Markets change fast.
Today’s consumer trends shape how businesses grow, sell, and plan ahead. Even B2B companies and small businesses feel the impact of how people spend, shop, and choose brands.
In this report, we break down the most important consumer market trends that leaders need to understand. Our goal is to help you make smarter decisions using facts, not guesses.
Consumer Market Trends: Key Numbers
- More than 70% of consumers expect brands to understand their needs and preferences
- Around 65% of consumers say price increases have changed how they shop
- Over 60% of shoppers now research products online before buying in store
- Nearly 75% of consumers prefer brands that offer personalized experiences
- About 55% of consumers are willing to switch brands for better value
- Over 50% of global consumers say sustainability affects their buying decisions
- Roughly 80% of shoppers compare prices across multiple platforms before purchase
- More than 45% of consumers prefer buying from brands they already trust
- About 70% of consumers say fast delivery influences where they shop
- Over 60% of consumers prefer digital payment options over cash
- Nearly 50% of shoppers say social media influences their purchase decisions
- Around 68% of consumers expect consistent experiences across online and offline channels
- More than 40% of consumers have abandoned a purchase due to poor user experience
- About 58% of consumers are spending more cautiously due to economic uncertainty
- Over 65% of consumers say convenience matters more now than brand loyalty
Sources: McKinsey, Deloitte, PwC, Accenture, Statista, IBM, Nielsen, Salesforce
01.
Consumer Spending Statistics
Consumer spending shows how people live, shop, and make choices every day. It reflects habits, priorities, and changes in daily life. These trends shape businesses, prices, and the overall economy. We share these insights below so you can better understand how spending patterns affect everyday decisions.
- In the first quarter of 2024, US consumer spending reached an all-time high of $15.67 trillion.
- In 2022, there was a 9.0 percent rise in consumer spending.
- Over the period from 2021 to 2024, spending by black consumers is projected to increase by 12.5%.
- Teens spend a total of $259 billion annually.
- On average, single men spent $41,203 per year, compared to $38,838 spent by single women.
- The average individual spends approximately $161 each month on clothing.
- Average American family spends $1,700 on clothes annually.
- Americans spend $779 on food each month, with nearly two-thirds ($475) going towards groceries and the remaining amount ($303) on dining out.

Sources: (BLS, Trading Economics, CreditDonkey, LendingTree, The Motley Fool
02.
Eco-Friendly Consumers Statistics and Trends
Eco-friendly choices are shaping how people shop and what brands stand for. Buyers care more about impact, responsibility, and long-term value, not just price. This shift affects trust, loyalty, and how products are made and marketed. We share what this shift means so you can see how buyer behavior is changing today.
- 72% of consumers said they buy more eco-friendly products than five years ago.
- Global online searches for sustainable goods have increased 71% in five years.
- 55% of consumers are willing to pay more for eco-friendly brands.
- Products marketed as sustainable grew 2.7X faster than products not marketed as sustainable.
- 77% of businesses indicate sustainability leads to increases in customer loyalty.
- 63% say sustainability boosts brand revenue.
- 66% of shoppers are now looking for eco-friendly brands.
- 75% of US consumers care about products environmental impacts.
- In recent years, 85% of consumers have become “greener” in their purchasing habits.
- 79% of consumers are changing their purchasing habits to reflect their sense of social responsibility.
- 50% of global consumers say they have become more eco-friendly in the past six months, according to a 2021 PwC survey
- 55% of consumers are willing to pay more for eco-friendly brands.
- 34% of consumers consider the environmental impact of their purchasing decisions.
- 62% of consumers are willing to change their purchasing habits to help reduce environmental impact.
- 22% of consumers say they have made major changes to be more environmentally friendly.
- 66% of consumers worldwide say they’re willing to pay more for sustainable brands.
- 73% of Millennials are willing to pay more for sustainable offerings.
- 45% of consumers are willing to buy more from companies that they believe care about the environment.
- 92% of customers are more likely to trust a brand that is environmentally or socially conscious.
- 53% of Consumers are prepared to spend extra for product packaging that is environmentally friendly, according to a recent survey.
- 81% of people throughout the world expect businesses to be environmentally conscious in all of their advertising and marketing activities.
- 52% of consumers want brands to create products with less packaging.
Sources: (Sustainable Brands, BusinessNewsDaily, PWC, LendingTree, Google)
03.
Health Conscious Consumer Statistics: Key Numbers
People are thinking more about what they eat and how it affects their daily life. Food choices now reflect care for wellness, ingredients, and balance. Cooking at home and reading labels feel more important than before. We share these insights so you can better understand how health-focused habits are shaping everyday choices.
- 50% of Americans claim to actively try to eat healthy.
- 62% say healthfulness is a key driver for food and beverage purchases.
- Over 70% of Americans are more conscious of their physical health after the COVID pandemic.
- 73% of consumers plan to eat and drink more healthily after the pandemic.
- 60% say the content they find on social media about food and nutrition has encouraged healthier choices.
- 63% of Americans say they consider whether the food is processed before purchasing it.
- 56% of those who prioritize healthy eating consume organic foods.
- 40% of consumers are cooking more meals at home to have greater control over what they eat.
- 93% say they feel compelled to eat healthy, at least some of the time. 63% say they try to eat healthy most, if not all, of the time.
- 1 in 4 consumers actively seek health benefits from foods.
Sources: (Statista Consumer Insights, FoodInsight, McKinsey, Pew Research Center, Consumer Food and Beverage Survey By L.E.K 2018, Food and Health Survey 2019, Nutrisystem and OnePoll, DSM)
04.
Shopping Local Statistics: The Key Data
Shopping local shapes stronger neighborhoods, supports nearby jobs, and keeps communities active. It helps small businesses grow while giving shoppers better service and unique choices. Local buying also builds trust and long term connections. We break this down below so you can see why supporting local businesses still matters today.
- 54.81% of Americans shop locally at least once a month.
- In 2023, shoppers are expected to spend $6.04 trillion in local stores.
- Small businesses generate $68 in local economic return for every $100 spent with them.
- The average person shops locally 213 times per year, or once every 1.7 days.
- 82% of consumers say they would spend more money to support local businesses.
- Dollars spent at independent businesses can recirculate 6 to 15 times in the local economy.
- Small businesses give 250% more to community causes than large businesses.
- 70% of consumers shop locally to boost the economy.
- 57% of Americans say they shop locally to keep money in their community.
- 97% of consumers search online for a local business.
- 28 percent of shoppers buy locally for better service, and 19 percent to support local nonprofits.
- 61% prefer to shop nearby because of the unique product selection.
Sources: (Redegg Marketing, Intuit, Business Journal Daily, Facebook, LinkedIn, United States Chamber of Commerce, Search Engine Journal, Smallbiztrends)
05.
Importance of Product Quality to Consumers
Product quality shapes how people feel about a brand and whether they stay loyal over time. When products meet expectations, trust grows and frustration stays low. Poor quality does the opposite and pushes customers away. We share what this means so you can better understand why quality matters so much.
- 74% of customers say product quality is the most important factor in keeping them loyal to a brand.
- 51% of consumers consider quality to be more important than price.
- 20% of product returns are due to defective or low-quality products.
- 63% of consumers are more inclined to spend money on quality items than on something that’s cheaper both in price and quality.

Sources: (First Insight, PR Newswire, Issuu, Lifesight)
Impact on Customer Trust and Satisfaction
Grasping how product quality affects customer trust and satisfaction is crucial for any business. The stats below show just how much a good product can boost trust and happiness. Check out these key numbers:
16.4% of customer trust is directly linked to the quality of the product.
53% of what makes customers happy is the product quality, and the rest, 47%, is due to other things.
Sources: (Issuu, EconJournals)
06.
The Importance of Product Packaging to Consumer
Product packaging shapes first impressions and builds trust before a product is ever used. It helps shoppers feel confident, excited, and ready to choose one brand over another. Strong packaging can turn a quick look into real interest and long term loyalty. We break this down below so you can see why packaging matters so much.
- 81% of consumers have bought a new product because the packaging caught their eye.
- 72% of consumers agree that packaging design can influence purchasing decisions.
- 30% of companies report a revenue increase after improving product packaging.
- 63% of consumers have repurchased a product because of its packaging design.
- 52% of customers are more likely to purchase from an online retailer again if they receive their items in premium packaging.
Sources: (Johnsbyrne, Globe Newswire, Packaging Of The World, Linkedin, Shipbob)
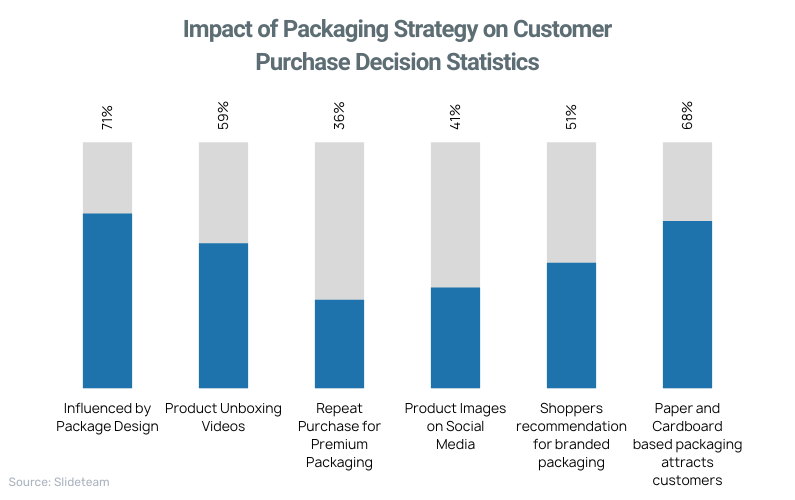
Influence of Packaging Design on Purchasing Decisions
Packaging design seriously impacts how consumers choose what to buy, shaping our perceptions and choices. Check out these stats that show just how much design and materials matter:
- 72% of consumers believe that packaging design can influence purchasing decisions.
- 67% of consumers said packaging materials influenced their purchasing decisions.
- 52% of customers have switched brands due to packaging.
- 81% of consumers pay extra attention to packaging when buying gifts.
- 81% of shoppers have tried out a new product simply because its packaging stood out to them.
Sources: (Ipsos, Enterprise League)
Product Packaging and Consumer Behavior
Packaging has a huge impact on consumer behavior, affecting what we buy and how we feel about brands. Check out these stats showing how important good packaging really is:
- 52% of people are more likely to be repeat customers for online retailers if their purchases arrive in high quality packaging.
- About 63-67% of U.S. shoppers think that products look pricier when they come in cardboard or paper packaging.
- 40% of shoppers post photos of products with unique packaging on their social media accounts.
- 63% of shoppers have bought a product again specifically because they liked its packaging design.
Sources: (Shipbob, Meteor Space, PRWeb)
07.
Thrifting Statistics: Key numbers
Thrifting is no longer a small habit or a niche trend. It has become a smart, normal way people shop for value, style, and choice. Online access and changing attitudes are pushing secondhand shopping into the mainstream. We break this down below so you can see why this shift matters and how it affects you.
- Between 16–18% of Americans shop at a thrift store.
- 93% of Americans shop for secondhand items online
- On average, thrift store shoppers save nearly $150 per month.
- Millennials accounted for 33% of second-hand apparel buyers in the United States.
- 83% of Generation Z are either already shopping or are open to shopping for secondhand clothes.
- In the past year, 58% of Gen Z who purchased secondhand apparel did so online, more than any other generation.
- 2 in 5 items in Gen Z’s closet are secondhand items.
- 37% of consumers increased spending on secondhand apparel last year
- 30% of Gen Z shop secondhand to buy higher-end brands.
- 1 in 3 apparel items bought in the last 12 months were secondhand.
- 75% of people have either bought or are open to buying secondhand clothing.

Sources: (America’s Research Group, Yahoo, Statisa, Thredup)
Thrift Store Industry Statistics
- There are 28,849 thrift store businesses in the United States, as per latest data.
- The average thrift store in the United States earns around $300,000 per year in revenue.
- The resale industry is expected to outpace the broader retail clothing sector by 9X times by 2027.
- 86% of retail leaders say their customers are buying resale, which is 8 points higher than in 2021.
- 82% of retailers offering resale believe it will bring a positive return on investment.
- About 2 out of 3 retailers plan to boost their resale investments in the next couple of years.

Sources: (ThredUP, GlobalData, Depop, NRF, Ibisworld, Yahoo, CNBC)
06.
Cash App Statistics
Cash App has grown into a major tool people use to send, spend, and manage money every day. It is popular across different age groups and fits easily into daily life. It also plays a strong role in how people handle payments and transfers. We share these insights so you can better understand its real impact.
- Cash App currently has over 57 million active users on its platform as of 2024.
- Cash App generated $14.68 billion in revenue in 2023.
- The Cash app has 51.57% female users and 48.43% male users.
- In 2022, they had over 528 million transactions.
- 50.25% of cash app users are between the ages of 25 and 44.

08.
Consumer Brand Loyalty Benchmarks: Apple & Restaurant Insights
Strong brands earn trust through habits and rewards. Apple shows how loyalty grows when products feel connected and familiar. Restaurants see the same effect when guests feel valued and rewarded. We share these insights so you can see how loyalty shapes choices.
- Apple has a 92 percent retention rate among iPhone users, while Samsung has a 77 percent retention rate.
- Apple has maintained a customer retention rate of over 90 percent for the past three years.
- iPhone users were 18% more loyal to the brand of their device than Android users.
- 84% of iPhone owners plan to purchase another Apple device to replace their current one.
- Apple had 74.6% trade-in brand loyalty.
- 57% of restaurants have reward and loyalty programs.
- Loyalty program members visit restaurants 20% more frequently and spend 20% more than non-members.
- 81% of consumers would join a restaurant loyalty program if it was offered.
- 78% of current loyalty users are more likely to visit a restaurant where they can earn points, even if it’s less convenient.
- According to a 2021 survey, the percentage of customers who use at least one restaurant loyalty program increased from 43% to 47.4%.
- Customers would increase their spending at a restaurant by 35% if it offered a compelling loyalty program.
- 73% of customers would recommend a restaurant with a good loyalty program to their friends and family.
- According to 41% of consumers, loyalty programs encourage them to buy from restaurants.
- 40% of diners would increase their spending if they were a loyalty member.
- 47% of diners participate in at least one loyalty program.
- 51% of loyalty program members say they would continue to visit the restaurant even if the program was devalued or changed.
- 55% of customers frequent restaurants where they can earn rewards at least twice a month.
Source: CNET, AppleInsider, Patently Apple, BankMyCell, Statista, MacRumors, Canalys Newsroom