200+ Retail & Online Marketplace Statistics: The Key Numbers (2025 Updated)
Retail did not always move this fast.
In the mid-1990s, online shopping began with a few early websites. By 2010, big marketplaces reshaped how people buy. In 2025, U.S. online sales passed $1.29 trillion, while retail overall reached trillions more across stores and digital channels.
For comparison, online sales now make up about 15% of all retail, a share that once sat near zero. Today, rising costs, returns, fraud, and platform changes are forcing retailers to rethink how they sell and compete. With that in mind, we will look at the key retail and online marketplace statistics that matter most today.
Retail Statistics: The Key Numbers
- There are 9.1 million online retailers in the world, and 2.5 million of them are in the United States.
- 15.1% of U.S. retail sales are made online, while 84.9% are made in physical stores.
- According to the National Retail Federation, retail sales will rise 4%-6% in 2023, reaching $5.1-5.2 trillion.
- According to projections, total global retail will reach $31.3 trillion by 2025.
- As of 2023, the US has 1,045,422 retail stores.
- There are 2.1 million US ecommerce retailers.
- 24% of cyberattacks targeted retailers, more than any other industry.
- The retail industry had 629 incidents and 241 breaches in 2022.
- Organized retail crime accounts for 1.47% of retailer sales.
- 81% of retail shoppers conduct online research before making a purchase.
- 54% of consumers say they are more likely to look at a product online before purchasing it in-store.
Sources: (etailinsights, United States Census Bureau, Bureau of Labor, NRF, Zippa, Chad, NFR)
02.
Retail Shrinkage Statistics
Retail shrinkage has become a serious problem for stores of all sizes. Losses stay near the same rate each year, but the total cost keeps rising fast. Theft, fraud, and process mistakes now take billions from retailers and hit profits hard. We share these statistics so you can clearly see the risks and understand why shrinkage deserves your attention.
- The average retail shrinkage rate has hovered around 1.4% for over a decade.
- Retailers report 26.5% increases in organized retail crime, employee theft, violence, and omnichannel fraud.
- Retail shrink cost retailers $94.5 billion in 2021, 1.44% of sales.
- Retail cost increased 53.16% in last two years due to shrink.
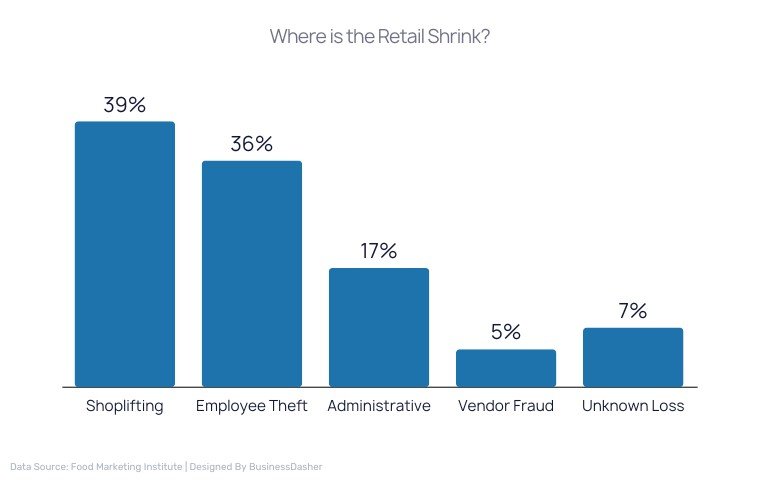
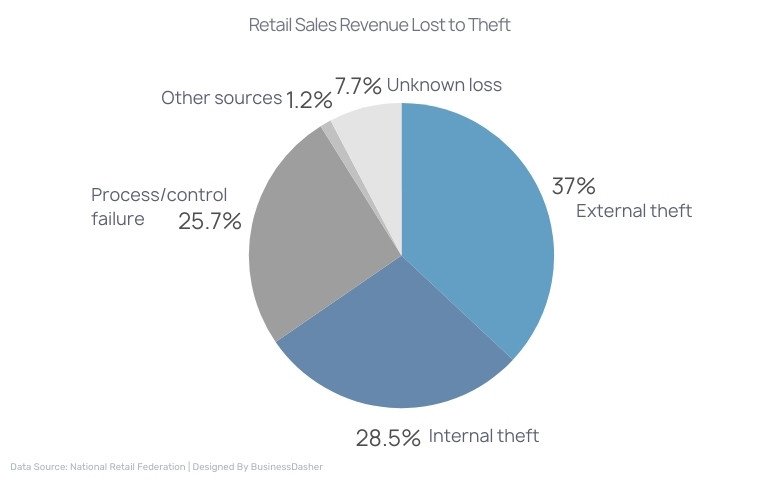
- Most retail shrinkage is caused by external theft (37%), employee theft (28.5%), and process or control failures (25.7%).
- Retailers reported 81% shrinkage increases in 2022.
- Store theft accounts for 40% of retail shrinkage.
- The average shrink rate as a percentage of sales dropped to 1.4% in 2021 from 1.6% in 2020.
- Employee internal theft accounted for more than a quarter (28.5%) of retail shrinkage.
- In 2021, nearly twice as many businesses reported shrink rates of 3% or higher than in previous years.
Sources: (CBS 58, Investors, Chain Storeage, NRF, Forbes, Tony Donofrio, Linkedin, CNN, CNBC, Shopify.)
03.
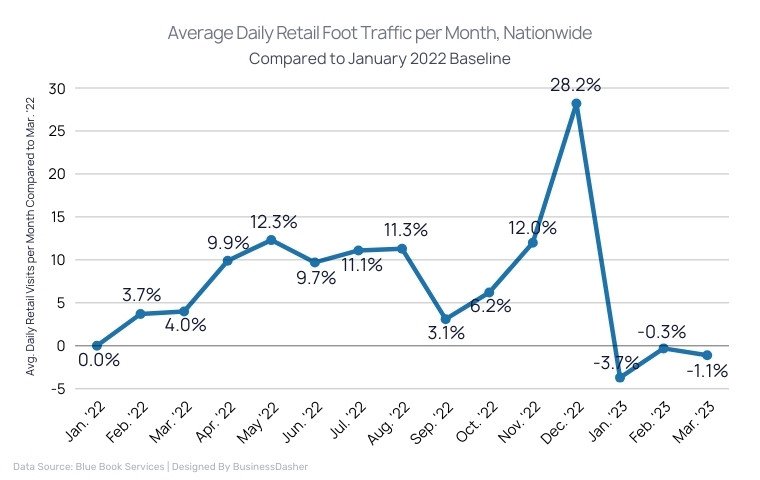
Retail Foot Traffic Statistics
Retail foot traffic shows how shopping habits shift with convenience, value, and experience. Some places see fewer visits, while others draw steady crowds because they meet everyday needs or offer something familiar. These changes affect how stores plan, staff, and compete. We break down these patterns below so you can understand where shoppers are really going.
- Retail traffic dropped 8.1% in March 2023 compared to March 2019.
- Global retail foot traffic fell by 62.5% in 2020.
- The most foot traffic increased at arts and craft supply stores (40%), department stores (34%), outlet malls (32%), and shopping centers (31%).
- Walmart, McDonald’s, and Subway have the most daily foot traffic in the U.S.
- Retail foot traffic was 3.9% higher during the week of November 7, 2021, compared to the same week in 2019.
- In Q1 2023, shopping visits rose 20% from the previous year.
- Walmart foot traffic rose 22.2%, year-over-year.
Sources: (Globest, Retail Customer Experience, Retaildive, Geekwire, Resonai, Gravy Analytics.)
04.
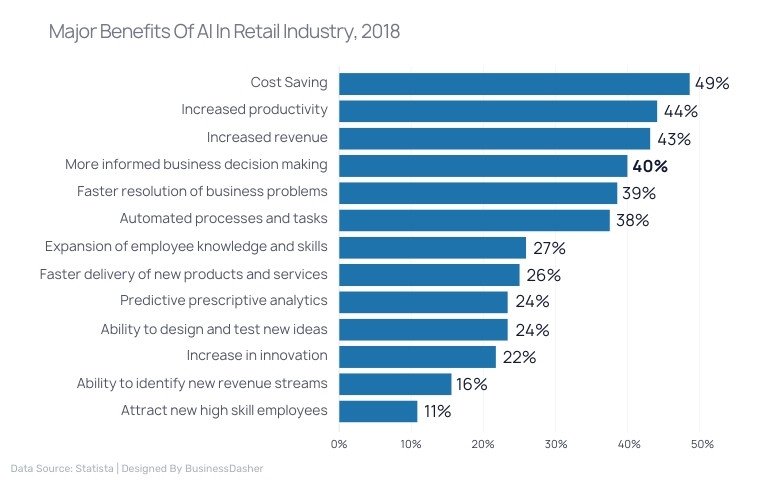
AI in Retail Statistics and Market
AI is quickly changing how retail works, from smarter planning to better customer experiences. It is helping stores move faster, make better choices, and stay competitive in a crowded market. We break down what this shift means so you can see how AI is shaping the future of retail.
- The market size of AI in Retail was valued at USD 6 billion in 2022 and is expected to experience a compound annual growth rate (CAGR) of over 30% from 2023 to 2032.
- In fact, it is estimated that $40 billion of additional revenue was driven by AI in retail in a 3-year span.
- 80% of retail executives expect their companies to adopt AI-powered intelligent automation by 2027.
- Currently, 4% retail use AI in their operations.
Source: (Gminsights, Hitachi, O’reilly)
05.
Retail Investor Statistics
Retail investing has opened the market to everyday people, far beyond big firms and financial hubs. More individuals are trading, learning, and taking risks from wherever they live. The impact is real, but the challenges are just as serious. We break this down so you can better understand how retail investors shape the market today.
- Over 1.5 million retail investors bought or sold shares in 2022.
- Every day, retail investors poured $1.51 billion into U.S. stocks.
- 69% to 84% of retail investors experience losses.
- Retail investors make up 10% of the 3,000 largest U.S. stocks’ daily trading value.
- About 15% of retail investors started in 2020.
- 95% of retail investors live outside of major financial centers and earn average wages.
- Retail investors now account for approximately 52% of global assets under management.
- Retail investors account for nearly 20% of stock market activity in the United States.
- Retail investors bought stocks worth $76 billion during a three-month period ending on May 24, 2022.
- Retail investors’ share of total trading volume rose from just above 10% in 2011 to over 22% in 2021.
Sources: (AMF, Yahoo, Coin Telegraph, Reuters, Contrary Research, Investing In The Web, Insider Inc, The Street.)
06.
Retail Theft Statistics
Retail theft is growing fast and hitting stores harder than before. It affects safety, prices, and how stores operate each day. The problem shows up in big chains and small shops alike. We share what matters most below so you can understand the risk clearly.
- The retail theft cost is expected to increase by 32.79% in next 3 years.
- Stores lost an estimated $86.6 billion to retail theft in 2022, with projections indicating that retail theft may cost stores over $115 billion in 2025.
- Target Stores saw a nearly 120% increase in theft incidents in the first five months of 2023
- The average theft rose from $937 in 2020 to $1,180 in 2021.
- Since 2019, major commercial locations have seen 53% more theft of items under $1,000.
- The average loss per theft incident is approximately $460.
- 74.1% of retailers reported increases in external theft from 2016 to 2021.
Sources: Food Institute, John Jay College of Criminal Justice, Statista, Capital One Shopping, The Hill)
07.
Amazon Statistics
Amazon has changed how people shop, sell, and run online businesses. It sets the pace for speed, choice, and trust across the market. Many buyers and sellers now depend on it every day. We break this down below so you can clearly see why Amazon matters so much today.
- Amazon has over 310 million users around the world.
- There are 9.7 million Amazon sellers worldwide, with 1.9 million actively selling on the platform.
- Amazon’s sales are expected to reach $746.22 billion in 2023.
- 92% of online shoppers have purchased an item from Amazon.
- 89% of online shoppers prefer Amazon to any other website for purchasing products.
- 64% of online shoppers have Amazon Prime.
- Americans spend an average of $91.75 on Amazon every month.
- Amazon makes an average of $1.29 billion in daily sales.
- Amazon currently lists over 353 million products.
- Amazon holds a 37.8% market share in retail e-commerce.
Sources: (Worldwide Business Research, Saras Analytics, Insider Intelligence, NPR, Forbes, CNBC, Helium 10, Retail Touch Points, Statista)
Amazon Seller Statistics
- Amazon has around 9.7 million sellers worldwide, and 1.9 million of them are active on the marketplace.
- In the US, there are 1.1 million active sellers on Amazon’s marketplace.
- Every day, roughly 3,700 new sellers join Amazon.
- 61% of sales on Amazon come from independent sellers.
- Amazon sellers averaged more than $230,000 in sales.
- Over 60,000 sellers on Amazon surpassed $1 million in sales.
- Amazon’s third-party seller revenue was $140.05 billion in 2023, up 19% from previous year.
- About 94% of Amazon sellers use the Fulfillment by Amazon service (FBA).
- 76% of Amazon sellers become profitable, with 63% seeing profitability within their first year.
- 55% of Amazon sellers report monthly sales of over $5,000.
Source: (eDesk, Thrive My Way, SellerApp, Amazon, Jungle Scout, The Street, Threecolts, Marketplace Pulse)
08.
Target Statistics: The Key Numbers
Target plays a big role in everyday shopping for families across the country. Its stores and online experience shape how people buy essentials, trends, and seasonal items. The brand continues to grow through loyalty, convenience, and trust. We highlight what matters most so you can understand Target’s real impact.
- Target has over 30 million weekly customers that shop in their stores.
- 80% of U.S. shoppers (about eight in ten Americans) shop at Target at least once a year.
- There are over 100 million Target Circle members.
- Target operates 1,978 stores in the United States as of February 2025.
- Target.com received 164.9 million visits in August 2023.
- Target’s annual revenue in 2022 was $107.6 billion, a 2.8% increase from the previous year.
- Target.com had a 2.1% market share and was one of the leading retail e-commerce companies in the United States.
- Each day, Target generates approximately $299 million in revenue.
- The overall customer satisfaction rating for Target is 80.
- 83% of customers at Target consider themselves loyal.
- The average Target shopper spends $49 per visit, which equates to approximately 21 visits per year.
- Target has 450 000 employees.
- 48.2% of Target’s customers are female, while 51.2% are male.
Sources: (Wikipedia, Business Insider, Similar Web, Statista, Comparably, Fool, Target Brands, Similar Web.)
09.
Walmart Statistics: The Key Data
Walmart plays a major role in how people shop every day, both in stores and online. Its wide reach shapes buying habits, prices, and competition across many markets. Shopping choices keep shifting as convenience and trust matter more. We break this down below so you can see why Walmart’s impact is hard to ignore.
- Walmart serves over 37 million customers per day and over 255 million customers per week.
- Walmart’s weekly customer visits increased by 6.25% from 2023 to 2024.
- 57% prefer Walmart for groceries, compared to 15% who prefer Amazon.com.
- Walmart is the world’s largest retailer, with over 10,482 locations in 24 countries.
- Walmart controls 6.3% of the US retail eCommerce market and 25.2% of the grocery store chain market.
- In fiscal year 2023, Walmart generated $82 billion in global e-commerce sales.
- In the fiscal year ending January 31, 2023, Walmart’s worldwide revenue was approximately $611 billion.
- 92% of Walmart customers are loyal.
- Walmart Marketplace had over 151,820 sellers in 2022, a 60.21% increase from 2021.
- Walmart Marketplace receives over 120 million unique monthly visitors.
- Walmart’s online sales grew by 74% during the pandemic.
Sources: (Walmart, Super Market News, Corporate, Statista, Forrester, Market Place, Retail Dive.)
10.0
Etsy Statistics: The Key Numbers
Etsy has become a major place where creative sellers meet shoppers looking for unique items. The platform shows both opportunity and growing competition, with clear shifts in who sells, who buys, and how success is changing. We share what matters most so you can see where Etsy stands today.
- Etsy currently has 8.13 million active sellers as per latest report.
- Between 2023 and 2024, the number of active Etsy sellers decreased by approximately 10.1%, dropping from 9.04 million to 8.13 million.
- There are 95.5 million active buyers on Etsy.
- Etsy has a 0.13% market share in the eCommerce platform market.
- Etsy generated over $2.671 billion in revenue in 2023, which ended on June 30, a 10.1% increase over the previous year.
- Etsy has a 40.1% customer retention rate.
- Average Etsy seller makes $2,900 per year, top earners $65,000 per month.
- 97% of Etsy sellers work from their homes.
- 62% of Etsy sellers are from the United States.
- Approximately 86% of Etsy sellers are women.
- On Etsy, the average conversion rate is about 1-3%.
Sources: (Etsy, Yahoo, 6 Sense, Macro Trends, Statista, Dark Yellow Dot, Thrive My Way, WSJ, Crafty Base.)
11.0
Costco Statistics: The Key Numbers
Costco stands out for trust, loyalty, and strong customer habits. Shoppers return often because they value quality, savings, and a simple buying experience. The brand continues to grow by focusing on members first and keeping stores efficient. We highlight these trends so you can see why Costco remains so powerful.
- Costco had 136.8 million members globally as of 2024.
- Costco’s global membership grew by approximately 6.96% from 2023 to 2024.
- As of July 2024, Costco has 871 locations worldwide, including 600 in the United States and 271 abroad.
- Costco’s membership program has a renewal rate of 92.7% in the US.
- Costco’s customer satisfaction rating rose to 81 in 2025, from 85 in 2024.
- The average Costco shopper spends slightly more than $100 per visit and makes 30 trips per year, totaling approximately $3,000 per year.
- Costco revenue rose 8.23% to $235.442B in the year ending May 31, 2023.
- Costco accounts for 55.5% of the wholesale club market.
- 21% of Costco customers return within three days.
- Costco leads the way with 55.5% of wholesale customers walking through its doors in August, followed by Walmart-owned Sam’s Clubs at 36.2% and BJ’s Wholesale at 8.3%.
- During the company’s fiscal year 2022, each Costco warehouse made $245 million in sales, up from $217 million in fiscal 2021.
Sources
- Costco Wholesale Corporation | Costco
- Costco Delays Membership Fee Hike as Member Growth Continues | Retail TouchPoints
- Costco, American Eagle Outfitters, and Trader Joe’s top customer satisfaction survey | VatorNews
- Costco Reveals How Much the Average Shopper Spends Per Visit — How Do You Stack Up? | Yahoo
- Costco Revenue 2010-2024 | COST | MacroTrends
- Costco vs. BJ’s vs. Sam’s: Here’s how they stack up | Yahoo
- [Solved] How does Costco interact with their customers? Could they expand/improve using Social Media? Is there a way they can… | CliffsNotes
- Costco killing it in market against rivals | Fox Business
- Costco Statistics – Costco Facts, Stats, Trends & Data (2025) | WallStreetZen
12.0
eBay Statistics: The Key Data
eBay remains a major place where people buy and sell every day, even as the online market keeps changing. Sellers compete for attention, and buyers expect value, trust, and choice. We break this down below so you can quickly see how eBay stands today and why it still matters.
- eBay has over 18.3 million seller accounts.
- There are 134 million active buyers on eBay worldwide.
- eBay has at least 1.7 billion active listings.
- eBay has an 83.33% customer retention rate.
- eBay receives approximately 722.7 million visits per month, with an average visit duration of 6.8 minutes.
- In 2022, eBay’s revenue was $9.7 billion, a 9.3% decrease from the previous year.
- eBay has only 3.5% of the US retail e-commerce market as of June 2022.
- eBay received 76 out of 100 index points for customer satisfaction.
- Promoted listings generated $319 million in advertising revenue for eBay, while third-party advertising generated $43 million.
- Revenue rose 5% to $2.54 billion in Ebay Inc.’s fiscal second quarter ended June 30, 2023.
- 16.4% of eBay sales are in “Electronics & Accessories,” the top category.
Sources: (Go Banking Rates, Statista, Big Commerce, Similar Web, Business Of Apps, Yahoo, Quora.)
13
Google Shopping Statistics & Facts
Google Shopping shapes how people find and choose products online. It connects shoppers with items fast and helps brands stand out at the right moment. Buying decisions often happen quickly, and visibility matters more than ever. We share what matters most so you can see how this platform drives real buying action.
- Google Shopping has 1.2 billion monthly searches.
- Google Shopping ads accounted for 76.4% of all ecommerce ad spend.
- Google’s shopping platform generates 85.3% of all clicks on Adwords.
- Google Shopping is proven to have 30% higher conversion rates than text ads.
- Google Shopping clicks are growing by 17.7% every year.
- Google Shopping accounted for 36% of product discovery searches.
- On average, 1.91% of Google shoppers make purchases after visiting a product page.
- On Google paid advertising, 60% of all clicks are for shopping ads.
- On average, Google Shopping ads cost $0.66 each time someone clicks on them.
- The average monthly budget for shopping ads across all industries is $770.41.
Sources: (Freewebstore, Adespresso, SmartInsights, ClickSlice, Clicky, Rank on Technologies, Yotpo, Datafeedwatch, Searchenginejournal)
14
Tiktok Shop Statistics: The Key Data
TikTok Shop has become a place where shopping feels natural, fast, and built into daily content. People discover products while watching videos, lives, and creator posts, and many brands now treat it as a real sales channel. We share what this shift means so you can see how buying behavior is changing.
- 33.3% of TikTok users will make purchases via the platform in 2023, up from 9.6% in 2022, and by 2026, that number will jump to 39.9%.
- TikTok accounts for 30% to 40% of the 80% increase in offline sales from their digital marketing efforts for some brands.
- 78% of small business owners reported that TikTok ads have a positive ROI.
- Consumer spending on TikTok has surpassed $2.5 billion globally.
- TikTok plans to generate up to $20 billion in merchandise sales through TikTok Shop this year, up from $4.4 billion last year.
- 78% of small businesses say TikTok ads drive profits.
- 55% of TikTok users had actually made a purchase after seeing a brand or product on the platform.
- 50% of TikTok users have bought something after watching a TikTok Live.
- 49% of TikTok users say the platform helped them make purchasing decisions.
- 58.2% of TikTok users said they used the platform for shopping inspiration.
- 39.1% Tiktok users actively look for products to shop in my feeds, stores, etc.
- 48% use Tiktok for information gathering on product purchases.
- 45% of Tiktok users shop based on paid influencer recommendations.
- 55% of TikTok users had actually made a purchase after seeing a brand or product on the platform
Sources:
- How Do TikTok Shoppers Worldwide Shop on TikTok? (% of respondents, Jan 2022) | EMARKETER
- TikTok is driving an offline lift in sales for some brands. | Modern Retail
- 78% of Small Businesses Say TikTok Ads Drive Profits—Majority Within 6 Months | Business Wire
- Consumer spending on TikTok has surpassed $2.5 billion globally. #tikt… | TikTok
- TikTok Shop Emerges as Amazon Rival, Powered by Indonesian Boom. | Bloomberg
- Student Beans
- Growing your community with TikTok LIVE. | TikTok For Business Blog
- Nearly Half of TikTokers Purchase From Brands on the App. | Adweek
- Shopping behavior on TikTok 2022 | Statista
- 27 TikTok Stats Marketers Need to Know in 2024 | Sprout Social
15.0
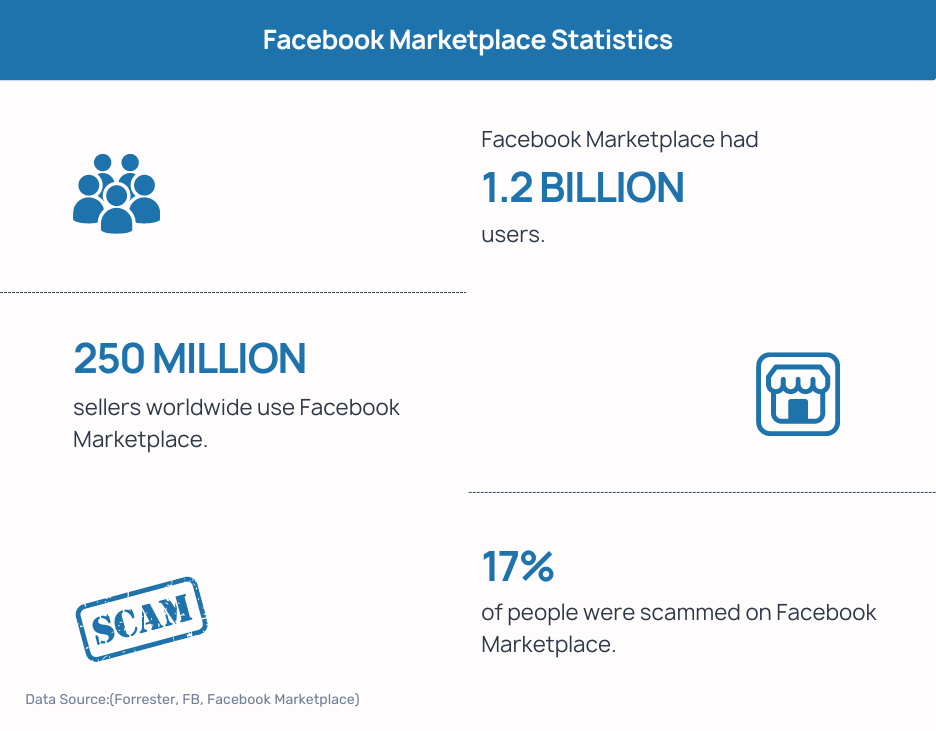
Facebook Marketplace Statistics
Facebook Marketplace has changed how people buy and sell online. It feels fast, local, and easy, which is why so many shoppers and sellers now rely on it. At the same time, trust and safety have become bigger concerns. We break this down below so you can see how it affects you.
- Facebook Marketplace had 1.1 billion users.
- 6 fake Facebook Marketplace ads are posted every minute.
- 474 million active users, or 16%, log in to Facebook solely to shop on Facebook Marketplace.
- 7% of all US Facebook users have purchased something via Facebook Marketplace.
- In 2021, Facebook Marketplace revenue was $26 billion, a 48 percent increase from the previous year.
- 14% of people had made a purchase using Marketplace, as opposed to 6% for Craigslist.
- 9% of people who had used Facebook Marketplace had been contacted by a fake profile.
- 17% of people were scammed on Facebook Marketplace.
- 70 countries use Facebook Marketplace.
Sources: (Forrester, FB, Facebook Marketplace)
16.0
Shoplifting Statistics: Key Numbers
Shoplifting is no longer a rare problem or a small loss that stores can ignore. It affects trust, safety, and everyday business decisions in many communities. The reasons behind it are complex and reach across age groups and backgrounds. We break this down below so you can better understand what is really happening.
- There are more than 500,000 shoplifting incidents occurring every single day.
- 66.6% of all shoplifters were under 30 years of age.
- 40% of people admitted to having shoplifted at least once.
- 66% of everyone surveyed knows someone who has committed shoplifting.
- 43% of women admitted to shoplifting in the past, compared to 37% of men.
- 52% of people said financial issues were the biggest reason for shoplifting.
- Just 1 in 48 shoplifting cases leads to someone getting arrested.
- Shoplifting makes up 2% to 3% of all retail sales.
- 69.4% of those arrested for shoplifting in 2019 were white, 26.6% were Black or African American, and 4% were from other races.
Sources: (Express Legal Funding and SurveyMonkey, CNN, NASP, National Association of Shoplifting and Theft Prevention Specialists, Office of Justice Programs, FBI)
Shift From Brick And Mortar To Online Statistics
- Currently, 15.4% of all sales are done online, while 84.6% are done in-store.
- Brick and mortar sales in the United States reached $3.6 trillion in 2022, with ecommerce sales accounting for $1 trillion.
- Brick-and-mortar sales increased by 8% in 2022, while e-commerce sales rose by 7.7%.
- By 2025, almost 35 percent of all retail sales are projected to be conducted online.
- Since 2001, online sales have increased by 300%, while department store sales have decreased by 50%.
- The number of physical retail stores in the United States has declined from over 450,000 in 2011 to just under 350,000 in 2021.
- Retail sales will rebound from a 3.2% decline in 2020 to a 1.6% increase in 2021.
- Since the beginning of the COVID-19 pandemic, 94% of consumers have returned to shopping in physical stores.
- 56.6% of Americans prefer to shop online over in-store, a 10% increase from 2020.
- By 2040, ecommerce is expected to facilitate 95% of purchases.
Sources: (Fool, Forrester, Digital Commerce 360, Bloomberg, Comarch, Tidio, Medium, Zippia, Fit Small Business, Linkedin.)
17.0
Online Shopping Statistics
Online shopping has become part of everyday life and continues to shape how people browse, compare, and buy. More shoppers now start their journey online, often using phones or voice tools, and expect speed and ease at every step. We share what this shift means so you can see how buying habits are changing.
- The number of online shoppers in the United States has increased by 17% in the last five years.
- As of 2023, there were 2.64 billion online shoppers worldwide.
- In 2022, there were 274.72 million US online shoppers, and by 2027, the number is projected to increase to almost 289.91 million.
- Approximately 80% of Americans have shopped online.
- Since 2010, global eCommerce sales have increased by nearly 800%.
- As of 2022, 21% of global retail sales are online, with the goal of reaching 27% by 2026.
- By 2023, global retail ecommerce sales will total $6.169 trillion and account for 22.3% of total retail sales, up from $3.351 trillion and 13.8% in 2019.
- 63 percent of shopping occasions begin online.
- Approximately 50% of shoppers shop more on mobile than in-store.
- The average person spent $5,381 online in 2023.
- 51% of online shoppers use voice search to research products before making a purchase.
Source: (Zippia, Drip, Oberlo, Tidio, Shopify, FitSmallBusiness, Oberlo, Statista, Insider intelligence, Thinkwithgoogle, 2018, Ibotta, 2018, Yahoo, Morgan Stanley, Insider Intelligence)
Shopper Demographic
- 73% of Generation Z said they shop online, and the majority (60%) said they do so at least once a week.
- 83.1% of millennials do the majority of their shopping online.
- Millennials, who are estimated to spend $1.4 trillion in 2020.
- By 2024, black consumer purchasing power is expected to reach $1.8 trillion.
- According to the “Taking Stock with Teen” research reports, the average teenager spends $2,391 per year.
- Americans spend $63,531 per year on average.
Shopping Online vs in Store Statistics
- 40% of consumers make an in-store purchase at least once a week, compared to 27% who make an online purchase at least once a week.
- 67% of millennials prefer online shopping to in-store shopping, compared to 72% of seniors who prefer in store shopping.
- Currently, about 20% of all retail sales happen online, compared to 80% in physical stores.
- 52% of Gen Z in the US prefer to shop online, while 48% prefer to shop in-store.
- 81% of retail shoppers conduct online research before buying.
- Physical stores are growing at a rate of 18.5%, while e-commerce is growing at a rate of 14.2%.
- 42% of holiday shoppers will research and buy online, while 23% will shop in-store.
Sources: (PWC, Statista, Tidio, GWI, General Electric, Census, Bigcommerce)
Baby Boomers Online Shopping Habits
- There are 76.4 million Baby Boomers, with a combined purchasing power of $548 billion.
- 21% of baby boomers shop online.
- 65.2% of Baby Boomer shoppers began their shopping journey on Facebook and Instagram.
- 80% of baby boomers consider price when making a purchase decision.
- Baby boomers spent 49% more online in 2020 than they did the year before.
- The average boomer spent $1,615 online from January to October 2021, up 49% from the year before.
- 52% of baby boomers shop online on computers, 24% on phones, and 11% on tablets.
- 45% of baby boomers shop online more due to the pandemic.
- Baby Boomers control 70% of US disposable income.
Sources: (Statista, Hubspot)
Gen X Online Shopping Habits
- Gen X has a total purchasing power of $357 billion.
- 43% of Gen X consumers shop online.
- 51% of Gen Xers have purchased an item through social media.
- Roughly, 66% of Gen Xers say they use their mobile phones most for online shopping.
- 40% of Gen X consumers discovered new products through online searches in the last three months.
- Gen Xers make nearly 19 online purchases per year on average.
- 22% of Generation X shoppers purchase groceries online.
- 53% of Gen Xers prefer big-box retailers such as Amazon.
- 29% of Gen Xers buy beauty and electronics online.
- On average, Gen Xers spend 37.4 hours per month online.
Sources: (Hubspot, Fisglobal, MarketingCharts, EMarketer)
Gen Z Online Shopping Statistics
- Gen Z consumers have $360 billion in purchasing power.
- 52% of Gen Z in the US prefer to shop online, while 48% prefer to shop in-store.
- 32% of Gen Z consumers shop online at least once a day, compared to 25% of millennials, 15% of Gen X, and 7% of baby boomers.
- Gen Z is 2X more likely to use an online-only store or brand website than any other generation.
- 96% of surveyed Gen Z consumers in the United States reported shopping online at least once a month in the first quarter of 2023.
- 58% of Gen Zers have increased their online grocery shopping.
- 51% of Gen Z cited price comparison as the leading advantage of online shopping.
- 54% of Generation Z say they will only shop online in the next decade.
- 43% of Gen Z consumers surveyed begin their online product searches on TikTok.
- 38% of Gen Z start their product searches on Google, compared to 36% on Amazon.
- 73% of Gen Z said that they shop online, and a majority of those shoppers (60%) said that they do so at least once a week
- 25% of Gen Z often make impulse purchases.
- 73% of Gen Z consumers are willing to pay 10% more for sustainable products.
- 52% of Gen Z in the US prefer to shop online, while 48% prefer to shop in-store.
Sources: (GWI, Yahoo, SurveyMonkey, ICSC, The Influencer Marketing Factory, Food Institute, FirstInsight, Bluestonepim)
Millennial Online Shopping Statistics
- 80% of millennials now do most shopping online, up from 60% in 2019, and 56% use their phones, up from 36%.
- Approximately, 57.79 million millennials shop online, according to our calculation from the latest data.
- According to the most recent data, millennials have a $2.5 trillion annual spending power.
- In the US, millennials’ spending accounted for 30% of total retail sales in 2020.
- 73% of millennials plan to spend the same or more online.
- 27% of millennials intend to spend significantly more online and less in physical retail stores.
- 91% of millennials prefer to shop online, with only 9% preferring to shop in-store only.
- Millennials spend $208.77 per day on average, more than any other generation.
- 40% of millennials read online reviews before making a purchase.
- 59% of millennials polled say they buy clothing and shoes online.
- 72% of millennials reported social media impacts their buying decisions.
- 40% of millennials are shopping on social media.
- 78% of millennials now follow brands on social media (up from 57% in 2017)
- 75% of millennials shop on Amazon compare to Walmart (46%), eBay (20%).
- 44% of millennials shop online because #1 factor that is fast shipping and more product options.
- Millennial shoppers spend more on grocery; this group reported spending a monthly average of $298 on groceries.
- The average 25- to 34-year-old reported spending $2,008 per year at coffee shops
Sources: (CouponFollow, ESW, BusinessWire, JungleScout)
18.0
Black Friday Statistics
Black Friday has grown into a major shopping moment that shapes how people buy and sell. It brings fast deals, strong demand, and heavy online activity, while stores and brands prepare months ahead. We break this down below so you can see how Black Friday behavior is changing and why it matters.
- Black Friday US consumer spending is expected to reach $9.8 billion in 2023.
- US Consumer spending is predicted to rise 7.46% in 2023 on Black Friday compared to last year.
- In 2022, approximately 125 million people in the United States shopped on Black Friday, accounting for 37% of the total population.
- The average Black Friday shopper spends $430.
- 69% of people shop online for Black Friday, compared to 32% in-store in 2022.
- On average, Americans saved 24% during Black Friday.
- On Black Friday 2022, Americans spent a record $9.2 billion online, an increase of 2.3% over the previous year.
- In 2021, mobile phones accounted for 43 percent of Black Friday sales.
- In 2022, Black Friday was the most popular day for in-store shopping in the United States, with 72.9 million people shopping.
- 13% of US retail sales occur between Black Friday and Christmas.
Sources: (Statista, Duncan Financial Group, Adobe, Glopal, Zippa)
19.0
Buy Online Pick Up In Store Statistics
Shopping habits have changed as people want speed, control, and easy pickups. Buying online and picking up in store fits busy lives and removes many common checkout problems. This shift affects how stores sell, serve, and plan for customers. We explain what this trend means so you can see why it matters.
- In the last six months, 67 percent of American shoppers used BOPIS.
- 75% of shoppers who have used BOPIS say they are likely to make additional BOPIS purchases.
- 50% of shoppers choose an online store based on whether they can pick up their order in-store.
- 50% of adult consumers use BOPIS.
- 49% picked click-and-collect to avoid shipping costs.
- In 2020, US shoppers spent $72.5 billion on click-and-collect fulfillment—9.1% of all ecommerce sales.
- BOPIS is preferred by 50% of shoppers due to its convenience.
Source:Radial, Icsc, Emarketer, Digitalcommerce360
BOPIS Usage by Generation
- 39.0% are Millennials (b.1981-1996)
- 36.1% are Gen Z (b.1997-2012)
- 17.8% are Gen X (b.1965-1980)
- 7.1% are Baby Boomers (b.1946-1964)
Source: U.S. Census Bureau and Statista
Why Shoppers Prefer BOPIS and Curbside Pickup
- 50% choose BOPIS/curbside pickup for convenience.
- 48% opt for it to avoid shipping fees.
- 39% use it to get their items faster.
- 34% prefer it to avoid going inside the store.
- 30% use it to ensure product availability.
- 29% select it to support local stores.
- 26% choose it for better return options.
- 25% use it to avoid crowds.
- 23% opt for it for better control over the pickup time.
Source: Digitalcommerce360
20.0
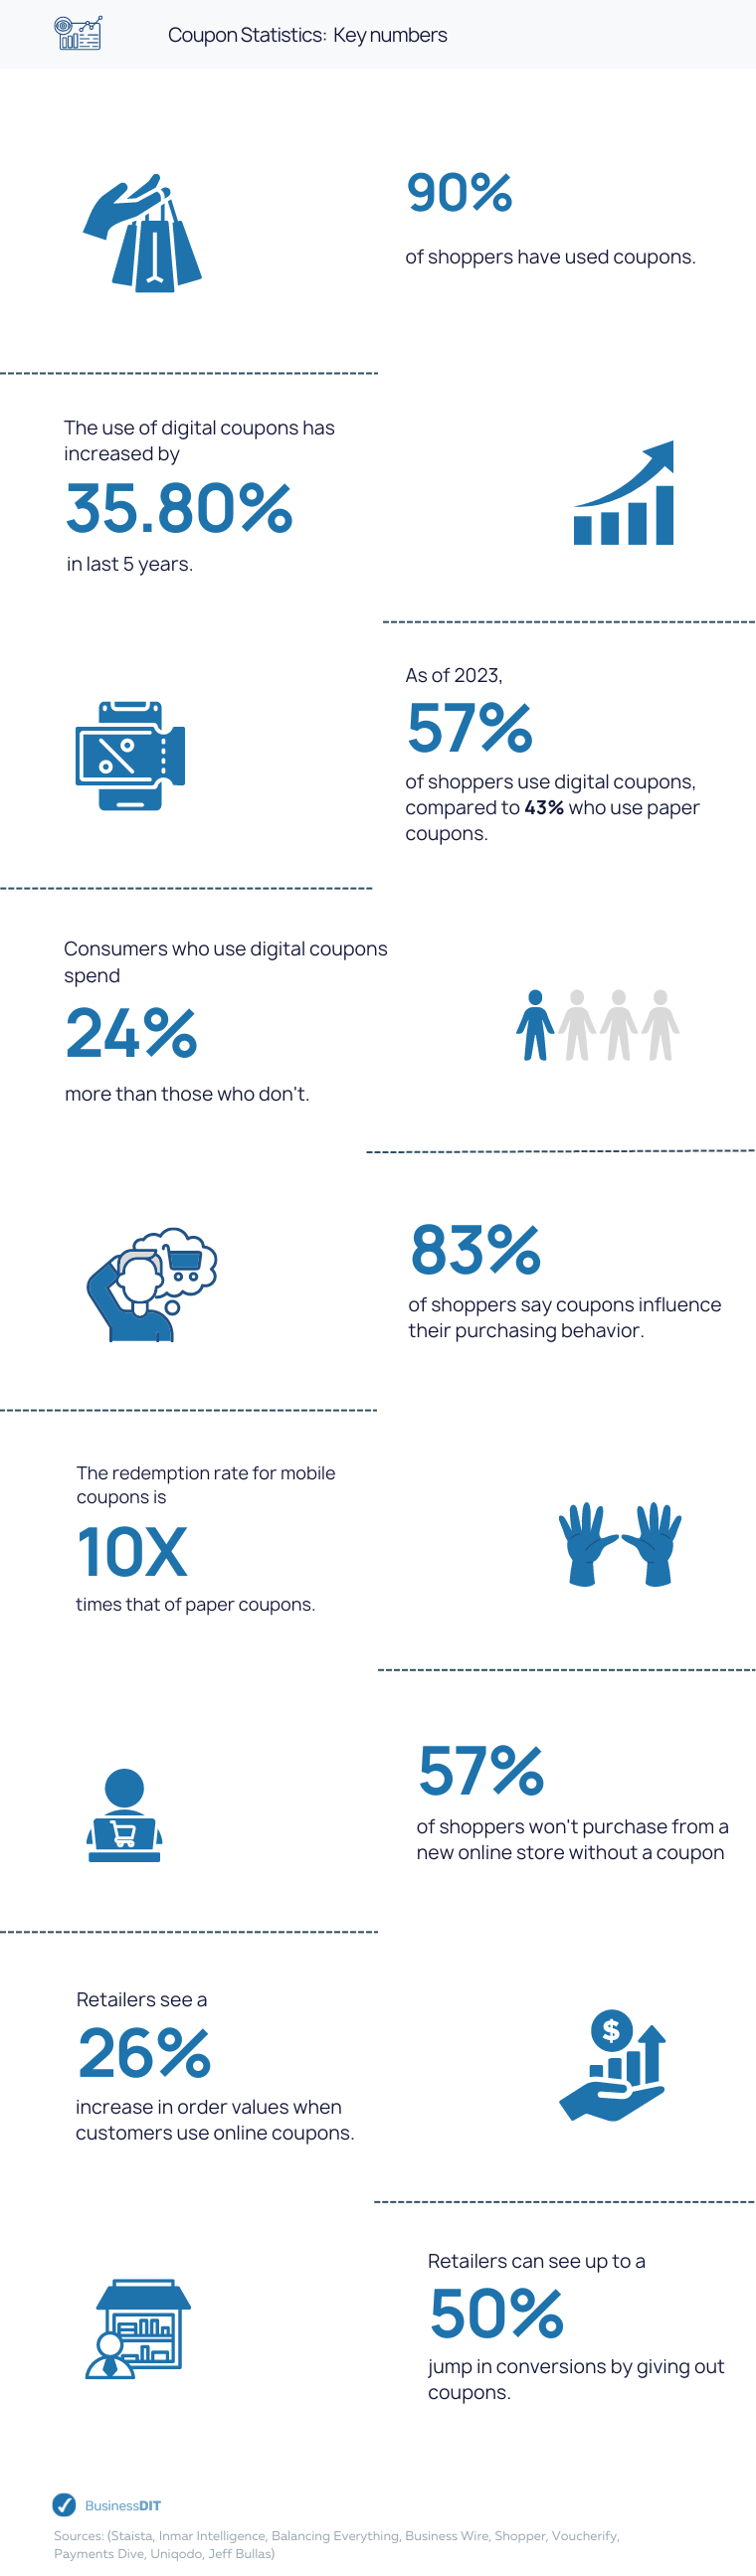
Coupon Statistics
Coupons shape how people shop, plan, and decide what to buy. They push shoppers to try new brands, spend more, and buy sooner than planned. Today, coupons are easier to use and part of everyday shopping habits. We share the key insights below so you can see how coupons truly influence buying choices.
- 90% of shoppers have used coupons.
- The use of digital coupons has increased by 35.80% in last 5 years.
- Consumers who use digital coupons spend 24% more than those who don’t.
- As of 2023, 57% of shoppers use digital coupons, compared to 43% who use paper coupons.

- 38% of people who have a coupon end up buying more than they planned.
- 83% of shoppers say coupons influence their purchasing behavior.
- 39% of consumers purchased a product earlier than intended due to a coupon.
- 39 percent of people used coupons to buy a brand they would not have bought otherwise, and 18 percent used coupons to switch back to a brand they had bought before.
Sources: (Statista, Inmar Intelligence, Balancing Everything, Business Wire, shopper, Voucherify, Payments Dive)