In 1953, the U.S. created the Small Business Administration to support local businesses. Fast forward to today, and small businesses power the economy.
There are over 33 million small businesses in the U.S., making up 99.9% of all businesses and employing nearly 46% of the private workforce. That’s more jobs than large corporations combined.
Now, rising costs, higher interest rates, and AI tools are changing how small businesses survive and grow. With that in mind, we’ll cover some powerful small business statistics are important for you to know.
Small Business Statistics: Key Numbers
- In the United States, there are 33.2 million small businesses and there are currently around 334 million businesses in the world.
- Over 200,000 businesses have closed their doors permanently due to COVID-19.
- Over 80% of small businesses have no employees, and 61.7 million people are employed by small businesses.
- Approximately 19.6% of small businesses fail within the first year.
- Only 34.5% of businesses survive 10 years.
- $26 trillion in economic developments contributed, when businesses decide to adopt green practices.
- 93.79% of small businesses use social media which approximately 30.57 million businesses in the USA.
02.
Small Business Formation Statistics
New businesses are opening at a fast pace across the country. Many people are turning ideas into action and choosing to build something of their own. This wave of new ventures shows strong confidence and ambition in the market. We break this down below so you can see what it means for you.
- An average of 4.4 million new businesses started every year.
- On average 425,729 new businesses open every month in the United States in 2023.
- Between January and June of 2023, nearly 2.7 million business startup applications were filed, up 5% from 2022 and 52% from 2019.
03.
Small Business Ownership Statistics
Small businesses drive local communities and keep the economy moving. They are built by people with different backgrounds, goals, and paths. Many start small, grow with trust, and rely on strong relationships. We share what matters most here so you can better understand the real picture behind small business ownership.
- The United States is home to an estimated 33.2 million small businesses.
- A striking 99.9% of all U.S. businesses fall into the small business category.
- 47.2% of small business owners are Gen X, 39.6% are baby boomers, and 12.9% are millennials.
- There are approximately 13.94 million businesses owned by women in 2023.
- A significant 85% of small businesses depend on word-of-mouth referrals to acquire new clients.
- Roughly 33% of small businesses achieve a decade-long lifespan.
- A notable 69% of small business owners initially launch their ventures from home.
- Optimism prevails among 62% of small business owners regarding their businesses’ future prospects.
- Confidence in managing their enterprises is expressed by 64% of small business owners.
- A satisfying work-life balance is reported by 82% of small business proprietors.
- 19% of small business owners work a whopping 60 hours per week.
Sources: SBA, Fundera, Smallbiz Genius, Fundera
Small Business Owner Demographics
Small business owners come from all kinds of backgrounds, with differences in gender, ethnicity, and age. Here’s a quick look at who’s running small businesses in the U.S.:
- 59% of small business owners are men, while 41% are women.
- 76.2% of small business owners are White/Caucasian, 5.2% are Black/African-American, 4.8% are Asian-American, and 4.7% are Latino.
- Among small business owners, 46% are Gen X, 41% are Boomers, 13% are Millennials, and 1% are Gen Z.
Sources: (National Women Business Council, Guidant Fanancials)
Average Age Of Small Business Owners Statistics
The average age of small business owners shows some interesting trends about who’s running businesses these days. Here’s a quick look at the age distribution among small business owners:
- 15.9% of small business owners are under 35 years old.
- 33.2% of small business owners are aged 35 to 49.
- 50.9% of small business owners are aged 50 to 88.
Sources: SBA
Baby Boomer Business Owner Statistics
Baby boomers are a huge part of the small business scene, owning a lot of businesses and providing jobs for millions. Check out the stats on their demographics, how they fund their businesses, and how happy they are with their ventures:
- Baby boomers own 41% of privately owned small businesses and franchises.
- There are 12 million small businesses owned by baby boomers.
- Baby boomer businesses employ over 25 million people.
- On average, 350K baby boomers sell their businesses per year.
- 37% of Baby Boomer small business owners use cash as their primary financing method.
- 73% of Baby Boomer small business owners are men, while 27% are women.
- 35% of Baby Boomer small businesses have been in operation for more than 10 years.
- 32% of Baby Boomer owners started their businesses because they wanted to be their own boss.
- 48% of Baby Boomer small business owners reported being very happy with their business.
Source: Marcumllp, Exit Strategies Group, Linkedin
Black Owned Businesses Statistics
Black-owned businesses make a huge impact on our economy, creating jobs and generating impressive sales. Here are some key points about their contributions and structure:
- There were 3,589,567 businesses owned by Black business owners.
- There were 3,455,000 Black-owned non-employer business.
- There were 1,273,002 Americans employed by black-owned businesses.
- 96% of Black-owned businesses have fewer than 20 employees.
- Black-owned businesses generated a total of $217.3 billion in sales.
- There were 134,567 Black-owned employer firms.
- Black-owned employer firms generated $133.7 billion in sales.
- The annual payroll for Black-owned businesses was $40.5 billion.
- Black-owned non-employer businesses made $83.6 billion in sales.
Source: U.S Census, SBCS
Hispanic Owned Businesses Statistics
Hispanic-owned businesses are making a huge impact in the economy with their contributions in different sectors. Check out these key stats:
- Hispanic-owned businesses account for 4.7% of total small businesses.
- Hispanic business owners owned 4,537,836 businesses.
- Hispanic-owned businesses generated a total of $619.8 billion in sales.
- There were 346,836 Hispanic-owned employer firms.
- Hispanic-owned businesses employed 2,930,548 workers.
- There were 4,191,000 Hispanic-owned nonemployer firms.
Source: U.S Census
Minority Owned Small Business Statistics
Check out how minority-owned small businesses are making waves in the U.S. economy, driving growth and innovation. Here are some key stats that show their impressive impact:
- There were 9,709,323 minority-owned businesses in the United States,
- Minority-owned businesses generate $1.78 trillion in gross receipts, with an average annual revenue of $184,123 per firm.
- 9.4 million people were employed by minority-owned businesses.
- 1,048,323 minority-owned firms had paid employees.
- There were 8,661,000 minority-owned businesses without paid employees, totaling $306.09 billion and averaging $35,341 per firm.
- 16% of all minority-owned firms are within the transportation and Warehousing sector.
Source: MBDA
Immigrant Owned Small Business Statistics
Immigrant entrepreneurs are crucial for economic growth and innovation. Check out these key stats that show how immigrant-owned small businesses are making a big impact in different sectors:
- Immigrants started nearly 1 in 5 new businesses in 2023.
- Immigrants are 80% more likely to start businesses in the U.S. than native-born citizens.
- 46% of immigrant nonemployer business owners were in transportation and warehousing.
Sources: SBA, MIT researcher, Gusto
04.
Small Business Owners Time Management
According to a study by TheAlternativeBoard, 19% of small business owner works a whopping 60 hours per week, and here is the breakdown of hours worked per week by small business owners.
| Percentage of Small Business Owners | Number of Hours Works per Week |
| 19% | 60+ |
| 30% | 50-59 |
| 33% | 40-49 |
| 14% | 30-39 |
| 5% | 30 |
05.
Small Business Failure Statistics
Running a small business is hard, and many owners face tough pressure early on. Money stress, weak planning, and poor market fit can slowly push a business off track. These challenges often grow before owners notice the warning signs. We break this down clearly so you can see where most businesses struggle and why.
- About 79 % of small businesses survive their first year, which means only 21% of small businesses fail in first years.
- More than 50% of new businesses fail within five years.
- 70% of small businesses fail in their 10th year.
- 82% of businesses that failed cited cash flow problems as a factor in their failure
- For 33% of small business owners, the greatest challenge is a lack of capital
- 60% of small businesses are not profitable.
- 37.9% of businesses fail within the first three years.
Source: (Office of Advocacy, Entrepreneur, Guidant Financial, SmallBizTrends)
Small Business Failure Rate By Year
Checking out how small businesses fare over ten years gives us a clear picture of their survival struggles. Here’s a breakdown showing the percentage of businesses that don’t make it each year:
| Years in Business | Failure Rate |
| 1 year | 20.40% |
| 2 year | 31.10% |
| 3 year | 38.60% |
| 4 year | 44.70% |
| 5 year | 49.40% |
| 6 year | 53.30% |
| 7 year | 57.20% |
| 8 year | 60.10% |
| 9 year | 62.40% |
| 10 year | 65.30% |
Sources: (BLS)
Reasons For Small business Failure
Small business failures are often attributed to a variety of common issues. Here are some of the main issues that lead to their downfall:
- No Market Need: 42%
- Ran Out of Cash: 29%
- Not the Right Team: 23%
- Get Outcompeted: 19%
- Pricing/Cost Issues : 18%
- Poor Product: 17%
- Need/Lack Business Model: 17%
- Poor Marketing: 14%
- Ignore Customers: 14%
- Product Mis-Timed: 13%
- Lose Focus: 13%
- Disharmony on Team/Investors: 13%
- Pivot Gone Bad: 10%
- Lack Passion: 9%
- Bad Location: 9%
- No Financing/Investor Interest: 8%
- Legal Challenges: 8%
- Don’t Use Network/Advisors: 8%
- Burn Out : 8%
- Failure to Pivot: 7%
Source: CBInsights
06.
Home Based Business Statistics
Home based businesses are no longer a side idea. They have become a serious way people start, grow, and sustain real companies from where they live. This shift shows strong stability, long term focus, and lower risk for many owners.
- 51.6% of all US small businesses are home based businesses.
- According to the SBA and reported by NYSED, only 20% of home-based businesses fail.
- With 33.2 million small businesses, approximately 15 million of which are home-based.
- 69 percent of startups are home-based businesses.
- Every 12 seconds, a new home-based business starts.
- 59% of home-based businesses are still run from home 3 years later.
- 60.1% of home-based businesses are non-employers.
- Home-based businesses generate $427 billion in revenue each year.
- 44% of home-based businesses are launched with less than $5,000.
- 70% of home-based businesses succeed in three years, compared to 30% of traditional businesses.
Sources: (SBA, SBA Advocacy, UH.edu, Web Archive, SBE council, IEDC Reports, Census, Insureon, NYSED)
07.
Family Business Statistics
Family businesses shape communities, create jobs, and carry strong values across generations. They face real pressure from change, growth, and family decisions, which makes long-term success challenging. We break this down below so you can understand why these businesses matter and what affects their future.
- 70% of family-owned businesses fail.
- According to familybusinesscenter.com, the average life span is 24 years.
- 33.6% of the S&P 500 companies are family-run, with the founding family owning an average of 18% of the company’s equity.
- In the US, there are 5.5 million family-owned businesses.
- An estimated 60% of US workers are employed by family-run companies.
- 40% of family-owned businesses survive to the second generation, 13% survive to the third, and only 3% survive to the fourth or beyond.
08.
Small Business Marketing Statistics
According to a recent study by the Knight Foundation, 60% of small businesses now consider the online an important tool in marketing and sales efforts. Small businesses are increasingly generating higher profits through their use of online marketing as latest small business statistics show that 78% of small businesses reported that their websites were successful in generating new leads and customers as well as raise brand awareness and increase sales. Here is a detailed breakdown of the small business marketing statistics.
- 73% of small businesses have a websites.
- About 47% of small business owners do all of their own marketing.
- Small business owners spend 20 hours a week on marketing.
- 60% of small businesses use digital marketing to attract customers and sales.
- Business blogging leads to 55% more website visitors.
- 47% of businesses spent less than $10,000 on digital marketing.
- 81% of shoppers research online before purchasing.
- 17% of small businesses invest in search engine optimization.
- 96% of small businesses use social media as part of their marketing strategy.
- 61% of marketers say generating traffic and leads is their most difficult challenge.
09.
Small Business Marketing Budget Statistics
Marketing budgets shape how small businesses grow, compete, and stay visible. Spending habits vary by goals, industry, and owner mindset, but many are shifting toward digital and long term visibility. We explain what these trends mean so you can plan your marketing with confidence.
- On average, a small business spends 8.11% of its total revenue on marketing
- 47% of small businesses spend $10,000 or less per year on digital marketing.
- 56% of small businesses plan to increase their spending on social media advertising.
- 41% of small businesses intend to boost their investment in online advertising channels such as Google search, banner ads, and retargeted ads.
- 61% of millennial business owners spend more than $50,000 on advertising annually, while 52% of baby boomer business owners spend less than $10,000.
- B2B enterprises that sell services devote 12% of their revenue to marketing.
Sources: (SBA, Gartner, Bigcommerce, Hubspot, and Revlocal, Prnewswire)
Small Business Owners Marketing Challenges Statistics
What are their top challenges when marketing their businesses?
- Finding new customers—60%
- Determining what is working/measuring performance—33%
- Lack of resources (time, budget, skills)—32%
- Retaining current customers—31%
- Creating a strategy/plan—25%
- Sending the right messages—25%
- Using multiple platforms/tools—24%
- Motivation—19%
Source: (Forbes)
Statistics On Marketing Tasks Where Small Businesses Need The Most Help
- Social media marketing—54%
- Email marketing—19%
- Contact management—13%
- Event management—8%
- SMS (text) marketing—6%
Small Business Email Marketing Statistics
- 64% of small businesses use email marketing.
- 54% of small businesses send emails at least once per week.
- 79% of small businesses say email marketing is important to their business strategy.
- 43% of small businesses have 500 or less email subscribers.
- 94% of small businesses write their own marketing emails instead of outsourcing their copywriting.
- 77% of small businesses average email click-through rates between 1% and 10%.
- 61% of small businesses with effective or very effective email copy have click-through rates of 6% or higher.
Sources: (Hubspot, AWeber)
10.0
Small Business Website Statistics
A small business website shapes trust, growth, and first impressions before anyone calls or visits. Many owners see its value, while others still hesitate or delay. Design, clarity, and purpose matter more than ever as people look online first. We share what this means so you can make smarter website decisions.
- 73% of small businesses have a website.
- 43% of small businesses plan to invest in their website performance.
- 23.5% of small business owners plan to build a website soon, while 3.5% have no plans.
- Seven out of 10 small business websites don’t include a call to action.
- 92% of business owners believe that having a website is the most effective digital marketing strategy.
- First impressions are 94% design related.
- 75% of consumers judge a business’s credibility based on their website
- 81% of shoppers research a business online before making a purchase.
- Small businesses with websites grow 2X as fast as those without.
- 48% of people said that the number one factor they used to determine a business’s credibility was their website design
- Over 1 out of 3 of small business owners feel that their business is too small for a website.
- Approximately 28.1 million websites using Google Analytics.
- There are an estimated 8.4 million websites using Google Analytics 4 as of March 2023.
Sources: (MarketingScoop, Instagram, Forbes, Massachusetts Institute of Technology, Forrester Research, Forbes, Kinesis, Toptal, Coastal Web Marketing, Red Signal, Web FX, Kiss Metrics, TrueList, Small Business, Forbes, Logic Web Media, Medium, Verisign, Help Develop, EConsultancy, HubSpot, and more).
11.0
Small Business Social Media Statistics
Social media is now a daily part of how small businesses connect, grow, and stay visible. It shapes how brands talk to customers, build trust, and stay competitive in a crowded market. We gather these insights to help you see how this shift is changing the way small businesses move forward.
- On average, 93.79% of businesses use social media.
- 77% of small businesses in the U.S. use social media for essential functions like sales, marketing, and customer service.
- 71% of small and medium-sized businesses use social media to market themselves.
- 59% of small businesses utilize social media mainly for customer service and communication.
- 44% of small businesses leverage social media to boost brand awareness.
- 41% of small businesses use social media to drive revenue.
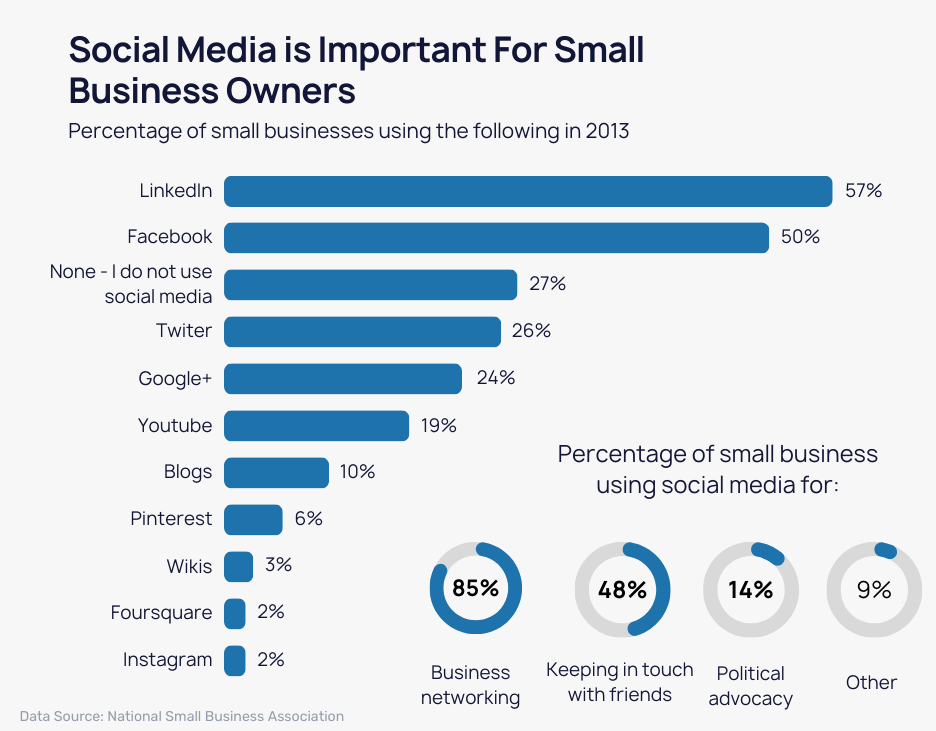
- 81% of small businesses incorporate Facebook into their social media strategies.
- 83% of small businesses post on social media several times a week.
- 48% of SMEs who use social media say it is critical to their business’ survival.
- 87% of small business owners report that social media has aided their business.
Sources: (BusinessDIT, Score, GetApp, Vocus and Duct Tape Marketing Survey)
Facebook Statistics For Small Business
- 90 million small business have a presence on Facebook.
- 3 billion+ people use Facebook monthly.
- Over 70% of Facebook users visit local business pages at least once a week.
- 63% of shoppers who use Facebook use it for shopping activities.
- 38% of small businesses consider Facebook the top platform for B2C marketing.
Sources: (Facebook, Hibu, Facebook Business, Statista, Fit Small Business)
Instagram Statistics for Small Businesses
- 71% of US businesses are on Instagram.
- Every day, at least 200 million Instagram users visit a business profile.
- 80% of people using Instagram follow a business profile.
- 2 billion people are active on Instagram each month.
- 70% of people who love shopping turn to Instagram.
Sources: (Linkedin, DataReportal, Instagram)
Tiktok Statistics for Small Business
- Over 7 million small businesses are on TikTok in the United States.
- Nearly 40% of small businesses say TikTok is crucial for their survival.
- There are 170 million active TikTok users in the US.
- $14.7 billion was generated by TikTok for SMBs in the US in 2023.
- SMBs’ use of TikTok supported 224,000 jobs in 2023.
78% of small businesses on TikTok plan to invest more in the platform.
- 81% of small businesses think TikTok is fun, and 73% find it easy to use.
- 67% of SMBs are optimistic about their growth on TikTok.

Sources: (Tiktok)
12.0
Small Business Revenue Statistics
Small business income can be uneven and often takes time to grow. Some owners struggle early, while others find steady ground through planning and persistence. Revenue depends on choices, support, and how a business is run day to day. We gather these insights so you can better understand how small business income really works.
- According to an estimate, 98% of small businesses make no profit in their first years, and 10% of them fail.
- The top 90% of small business owners earn $94,000 or more per year, while the bottom 10% earn $27,000 or less per year.
- Small businesses with no employees average about $46,978 in annual revenue.
- The average sole proprietor earns less than $25K in revenue per year, with net income of around $7K.
- The average small business makes $100,000 in revenue per employee.
- In 2022, over 65% of small businesses operating were profitable.
- 71% of small businesses run by women are profitable.
- Only one in 20 small businesses makes over $1 million in revenue.
- In fiscal year 2022, the SBA loaned over 47,000 small businesses $25.7 billion in 7(a) loans.
- The median income for self-employed incorporated business owners was $55,858.
Sources: ( Census.gov, Forbes, Quickbooks Intuit, SBA.gov, NFIB)
Small Business Revenue Range
| Firm With | Average Annual Revenue |
|---|---|
| 0 employee | $46978 |
| 1-4 employee | $387,000 |
| 5-9 employee | $1,080,000 |
| 10-19 employee | $2,164,000 |
| 20-99 employee | $7,124,000 |
| 100-499 employee | $40,775,000 |
Average profit for small business
| Firm With | Average Profit Anually |
|---|---|
| 0 employee | $4,458.41 |
| 1-4 employee | $36,733.03 |
| 5-9 employee | $102,510.77 |
| 10-19 employee | $205,401.22 |
| 20-99 employee | $676,191.44 |
| 100-499 employee | $3,870,256.29 |
13.0
Small Business Debt Statistics
Small business debt affects daily choices, long term plans, and peace of mind for owners across many industries. It shapes how businesses grow, hire, and handle tough moments. Debt has become a common part of running a business today. We look at the trends below so you can better understand how debt is impacting small businesses like yours.
Small business debt plays a huge role in how businesses run and grow. Here’s a closer look at how debt affects small businesses:
- The average small business debt is around $195,000
- 70% of small businesses have outstanding debt.
- Fed’s financial stability study show small business debt at $17.7 trillion in 2022.
- Experian found that the average US small business owner owes $195,000 in debt.
- 32% of business owners applied for a loan in order to refinance or pay down debt in 2020, compared to 30% in 2019.
- 79 % of employer firms have debt, up from 71 % in 2019.
- The amount of debt firms hold also increased; the share of firms with more than $100,000 in debt rose from 31% in 2019 to 44% in 2020.
- 50% of firms took out debt to address their financial challenges.
- 36% firms did apply for loan because of the amount of debt they currently have.
Sources: (Experian, FedsSmallBusiness.org, Fed’s Financial Stability Report, FedSmallBusiness Reports)
14.0
Small Business Bankruptcies Statistics
Small business bankruptcies reflect pressure from cash strain, rising costs, and sudden market shifts. These events often follow long periods of stress rather than one single failure. We see closures happen when obligations grow faster than income and options run out. The trend highlights how fragile many businesses can be during hard times.
- In the year 2022, 13,125 business bankruptcies are reported.
- 16,140 business bankruptcies were reported in the fiscal year 2021.
- 391 corporations filed for bankruptcy in 2022.

15.0
Small Business Lawsuit Statistics
Running a small business can involve legal pressure that arrives without warning. Lawsuits often come from routine issues tied to operations, employees, or public access. We see legal risk treated as rare until a dispute forces action. Even a single claim can disrupt focus, finances, and long-term plans.
- Every year, small businesses are sued to a range of 36% to 53% according to SBA.
- 43% of small businesses have been threatened with a lawsuit.
- Each case could cost up to $150,000, especially if it goes to trial.
- At some point in their lifespan, 90% of all businesses face lawsuits.
- Since 2013, there has been a 320% rise in ADA lawsuits.
Sources: (Zenefits, FullBright)
16.0
Small Business Insurance Statistics
Running a small business involves risks that can disrupt operations and long-term stability. Insurance choices affect how losses are handled and how recovery unfolds after setbacks. We often observe gaps in coverage that leave businesses vulnerable during unexpected events. Proper protection plays a quiet but important role in keeping a business steady.
- 40% of small business owners have no insurance at all.
- 75% of businesses are not adequately insured.
- A general liability policy averaged $42 per month or $500 per year.
- 54 % of small business owners purchase general liability insurance.
- 76% of small businesses don’t buy insurance online.
- 7 million small businesses depend on commercial insurance to stay afloat.
- 52% of 3-9 employee small businesses do not provide health insurance.
- 31% of SMBs have cyber insurance.
- Over the next decade, 40% of small firms will file an insurance claim.
- Burglary and theft account for 20% of small business insurance claims.
- 6.6% of small business insurance claims are for property damage from fire, storms, or busted pipes.
Source: (Nytimes, The Hartford, Insurance Journal , Yahoo, PWC, Forrester, ChamberofCommerce, BusinessInsider)
Small Business Health Insurance Statistics
- 56% of small employers currently provide health insurance to their employees.
- 89% of firms with 30 or more employees offer health insurance.
- 39% of businesses with 1-9 employees provide health insurance.
- 65% of small employers do not offer health insurance because it is too expensive.
- 88% of independent businesses with 30 or more employees say they do not offer health insurance because of the high cost.
- 63% of businesses with 1-9 employees say cost is the primary reason for not providing health insurance.
- 70% of businesses with 10-29 employees cite cost as the primary reason for not providing health insurance.
- Nearly 50% of small employers that do not offer health insurance do not plan to offer it in the future.
- 63% of all employers believe that providing health insurance is critical for attracting and retaining workers.
- 94% of small employers find it challenging to manage the cost of offering employer-sponsored health insurance.
- 98% of small businesses that provide health insurance are concerned that the costs will become unsustainable in the next 5-10 years.
Sources: (NFIB,)
Small Business Cyber Insurance Statistics
- 31% of SMBs have cyber insurance.
- 57% of SMEs have experienced cybersecurity breaches.
- The total average cyber insurance claim for SMEs between 2017 and 2021 is $345,000.
- From 2016 to 2020, SMEs accounted for 99% of cyber insurance claims.
- Annual cyber insurance premiums are expected to rise by 25-30% per year through 2025.
Sources: (Guardz, CyberScout, Netdiligence, S&P Global Ratings)