98+ B2B Social Media Statistics: The Key Data (2026 Updated)
In the early 2010s, businesses started talking to other businesses on social media. What began with LinkedIn posts and Twitter updates quickly turned into a core marketing channel. By 2024, social media drove over 80% of B2B leads, with LinkedIn alone influencing millions of buying decisions. For comparison, trade shows once led this space.
But the game is changing in 2026. Organic reach is dropping, algorithms are tighter, and paid content and AI tools now shape visibility. With that in mind, we will cover some key B2B social media statistics that help you understand trends, plan smarter, and make better decisions for your business growth.
B2B Social Media Statistics: Key Numbers
- 77% of B2B marketers use social media to reach potential customers.
- LinkedIn generates over 80% of B2B social media leads.
- B2B buyers spend about 1 hour per week researching products on social media.
- 75% of B2B buyers use social media to support buying decisions.
- LinkedIn is used by over 65% of B2B companies worldwide.
- Short-form video gets the highest engagement for B2B content.
- 70% of B2B marketers say social media helps build brand trust.
- Employee-shared content gets 2× more engagement than brand posts.
- Paid social ads influence over 50% of B2B purchase decisions.
- B2B companies that post weekly see higher lead quality than those that don’t.
Sources:
B2B Social Media Customer Service Statistics
- Customers spend 20-40% more with companies that respond to social media customer service requests.
- A social media interaction costs $1, whereas a call center interaction costs $6.
- The churn rate is 15% higher for businesses that do not respond to customers on social media channels.
- Companies that engage with their customers on social media can cut their cost per contact by up to 83%.
- Responding to customer complaints on social media can lead to a 25% increase in brand advocacy.
- Customers prefer social messaging for customer service increased 110% in 2020-2021.
- 40% of consumers expect a response within an hour of contacting a brand via social media.
- 72% of people who tweet a complaint to a brand expect a response within an hour.
- 71% of customers who have a positive experience with a brand’s social media will recommend it to others.
Sources:
- Effective end-to-end customer service with social media | McKinsey
- Why the COO should own social media service | McKinsey
- How to Use Social Media for Customer Service: Best Practices & Tools. | Talkative
- HubSpot
- How to Handle Complaints on Social Media | Hallam
- 30 Social Direct Message Examples [Free Template] | Sprout Social
- 12 Key Findings From The 2020 Sprout Social Index | Medium
- The State of Social Media Customer Support | Invesp
- Study: 72% Of Consumers Expect Brands To Respond Within An Hour To Complaints Posted On Twitter. | MarTech
- Reputation X
Instagram B2B Statistics
Instagram is getting really important for B2B companies. Why are so many B2B brands using Instagram, and how is it affecting their engagement and decisions? Check out these key stats that show Instagram’s role for B2B businesses:
- 33% of B2B brands are on Instagram.
- 13% of B2B brands rate Instagram as “very important” or “critical.”
- 36.2% of B2B decision-makers use Instagram to research new products or services.
- Instagram drives 20 times more engagement for B2B companies than LinkedIn.
- 49% of B2B marketing teams consider Instagram to be one of their most trusted social media platforms.
- There are over 200 million businesses on Instagram .
- 71% of U.S. businesses use Instagram.
- 90% of Instagram users follow a business.
- Approximately 25 million businesses use Instagram in the US.
- Over 200 million Instagram users visit at least one business profile every day.
- 97.6% of U.S. marketers use Instagram.
- 36% of businesses use stories to promote their products.
- 4 million businesses use Instagram Stories ads every month.
- 81% of people use Instagram to research products and services.
- Instagram business accounts have an average monthly follower growth rate of 1.46%.
Sources: (Instagram Business, eMarketer, GWI Report, Adobe, Facebook, Thryv, AdEspresso, OneIMS, DashThis)
Facebook Statistics For Businesses: Key Numbers
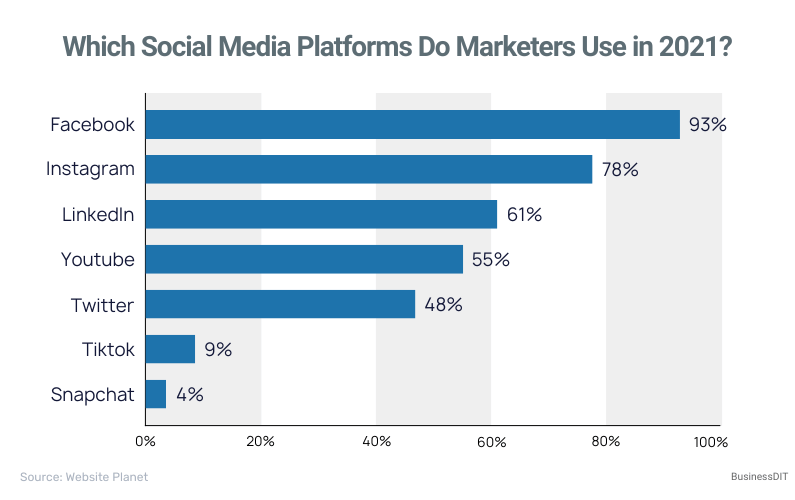
- 93% of businesses are active on Facebook.
- Over 200 million businesses are on Facebook.
- 3 million businesses actively advertise on Facebook.
- There are over 60 million active business pages.
- About 40 million businesses are actively using Facebook Messenger.
- 10 million advertisers are actively promoting their products and services on Facebook.
- 93% of marketers use Facebook ads regularly.
- 62% of brands believe Facebook provides a positive ROI..
- 89% of marketers around the world are utilizing Facebook.
Sources: (Facebook, SocialPilot, Statista, Hootsuite , Statista)
B2B Reddit statistics
- Reddit has over 70 million daily active users.
- Over 40% of Reddit users research products or services on the platform before making a purchase decision.
- B2B buyers are 2× more likely to trust Reddit discussions than branded marketing content.
- More than 100,000 active subreddits exist, many dedicated to B2B niches like SaaS, marketing, startups, cybersecurity, and finance.
- Reddit users spend an average of 20–30 minutes per session, indicating high engagement compared to most social platforms.
- 47% of Reddit users are aged 25–44, aligning closely with decision-makers and professionals.
- Reddit Ads generate up to 2.5× higher brand lift for consideration compared to other social platforms.
- Technical and B2B subreddits often rank on page one of Google.
- AMAs (Ask Me Anything) used by B2B brands increase engagement by over 3× compared to standard posts.
- Reddit traffic to B2B SaaS sites converts higher than general social traffic due to intent-driven discussions.
Sources: Reddit IPO Filing, Reddit Ads Blog, Statista, Pew Research Center, HubSpot, GWI, Similarweb
TikTok Statistics For Buisness: Key Numbers
- There are 7 million businesses on TikTok in US.
- There are about 225,000 business brands on TikTok.
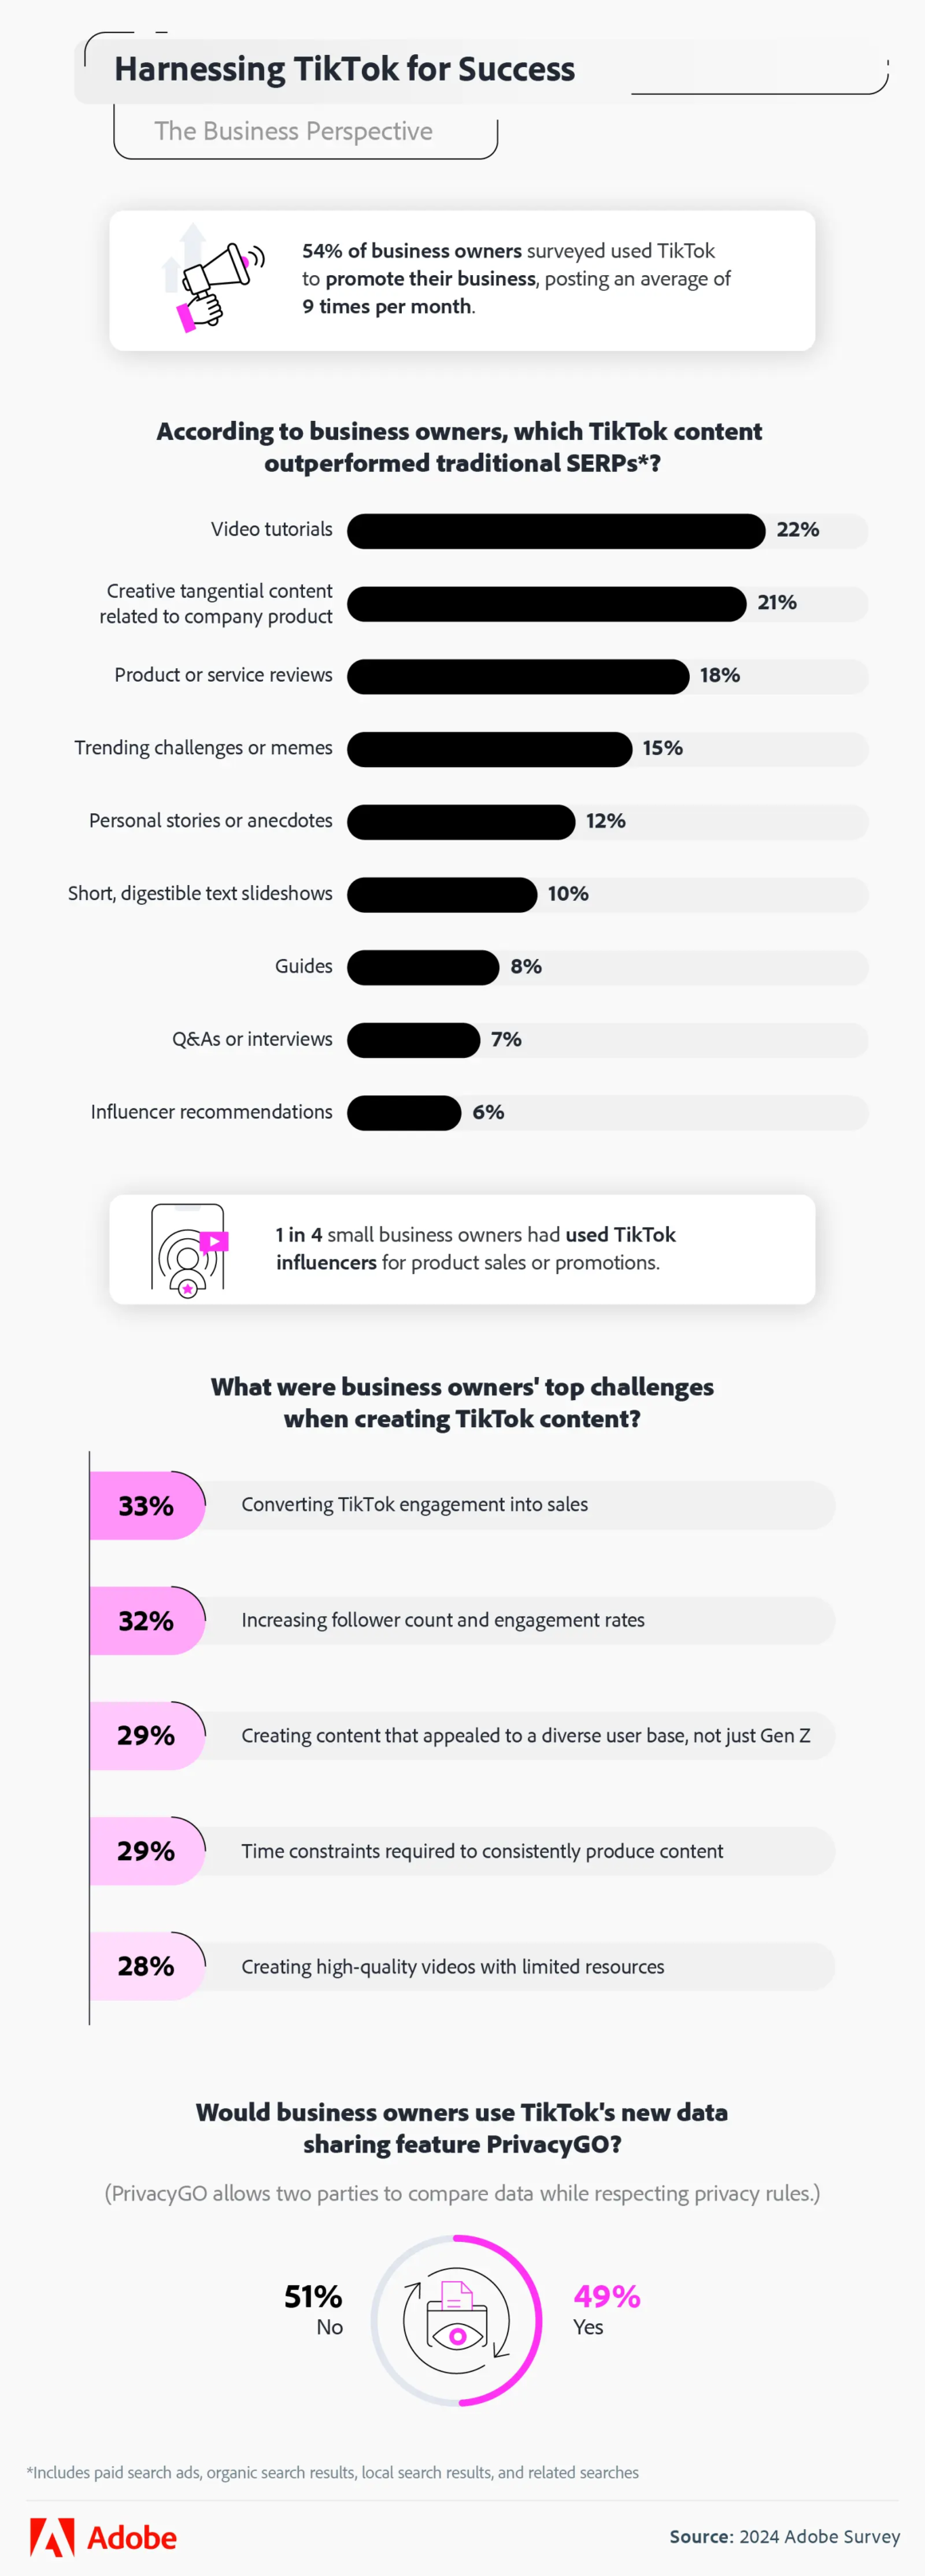
- In 2023, TikTok generated $14.7 billion for small and medium-sized businesses (SMBs), with an additional $24.2 billion in total economic activity.
- More than half of business owners (54%) use TikTok to promote their business, posting an average of 9 times per month.
- 39% of SMBs say TikTok is critical to their businesses’ existence.
- On average, businesses allocate 15% of their marketing budgets to TikTok.
- More than half of business owners (54%) use TikTok to promote their business, posting an average of 9 times per month.
- A 2021 study found that 49% of TikTok users purchased products or services after seeing them promoted on the platform.
- Approximately 50% of TikTok users have made a purchase after watching a TikTok Live.
Sources: (Oxford Economics Reports, 2024 Adobe Survey, Business Wire, Wikipedia, UMICH)
Twitter Statistics For Business: Key Numbers
- There are about 118 million businesses that use Twitter worldwide.
- Nearly 70% of small businesses use Twitter to connect with customers.
- Approximately 85% of small and medium-sized businesses (SMBs) use Twitter to provide customer service and interact with their audience.
- 93% of people who follow SMBs on Twitter plan to purchase from them.
- 29% of Twitter users expect businesses to respond to their messages within an hour.
- Around 41% of Twitter users have purchased a product after seeing an ad on the platform.
- Twitter ads can reach approximately 6.5% of all internet users worldwide.
Source: (Social Media Examiner, Statista, Eurostat, OECD, World Bank, Statistisches Bundesamt, and US Census Bureau, SidesMedia, VentureHarbour, SocialPilot)
WhatsApp Business Statistics: Key Numbers
- Number of Businesses: Estimated, over 50 million businesses are using WhatsApp worldwide, according to multiple sources.
- Business Adoption: As of 2024, WhatsApp Business has over 966.5 million monthly active users. (Statista)
- Global Reach: WhatsApp is available in over 180 countries and supports more than 20 languages. (Source)
- Message Volume: Over 100 billion messages are sent daily on WhatsApp. (AiSensy)
- User Engagement: Users spend an average of 19.4 hours per month on WhatsApp. (AiSensy)
- Catalog Views: More than 40 million people view a business catalog on WhatsApp each month. (Source)
- Customer Engagement: 83% of customers use messaging apps like WhatsApp Business to learn about products, and 75% of them proceed to make a purchase. (Trengo)
- Chatbot Adoption: Chatbots, including those on WhatsApp, have seen a 92% increase in usage since 2019. (Trengo)
- Revenue Growth: In 2021, WhatsApp Business generated approximately $1.2 billion in revenue worldwide. (Trengo)
- User Demographics: WhatsApp is most popular among users aged 26-35, followed by those aged 36-45. (AiSensy)
- Message Open Rate: WhatsApp messages boast a 98% open rate, significantly higher than traditional email marketing. (AiSensy)
- Conversion Rate: Businesses experience up to a 45-60% conversion rate when using WhatsApp for marketing. (AiSensy)
- Abandoned Cart Recovery: Automated WhatsApp messages help recover 45-60% of abandoned carts and application drop-offs. (AiSensy)
- Chatbot Efficiency: By 2025, businesses are expected to save approximately 2.6 billion hours through the use of WhatsApp chatbots. (AiSensy)
- User Trust: 66% of users have made a purchase after communicating with a brand on WhatsApp. (Source)
- Daily Usage: 83% of users open WhatsApp daily, indicating high user engagement. (Analyzify)
LinkedIn B2B Statistics
- Lead Generation: 80% of B2B leads generated on social media come from LinkedIn. (Source)
- Content Distribution: 94% of B2B marketers use LinkedIn to distribute content. (Source)
- Marketing Success: 82% of B2B marketers report success on LinkedIn. (Source)
- Lead Effectiveness: 40% of B2B marketers rate LinkedIn as the most effective channel for driving high-quality leads. (Source)
- Decision Makers: 4 out of 5 LinkedIn members drive business decisions. (Source)
- Lead Generation Usage: 89% of B2B marketers use LinkedIn for lead generation. (Source)
- Conversion Rates: Marketers experience up to 2x higher conversion rates on LinkedIn compared to other platforms. (Source)
- Purchase Intent: Brands have observed a 33% increase in purchase intent resulting from ad exposure on LinkedIn. (Source)
- Ad Reach: LinkedIn ads have the potential to reach over 14% of the world’s adult population. (Source)
YouTube Statistics For Business: Key Numbers
- Only 9% of small businesses use YouTube.
- There are approximately 2.98 million small businesses that use YouTube.
- 83% of small and medium-sized businesses (SMBs) have found YouTube effective in building a local customer base.
- Over 2.5 billion people use YouTube each month.
- 70% of small and medium-sized businesses pay to advertise their videos on YouTube.
- 83% of small and medium-sized businesses with a YouTube channel believe it helps them reach new audiences and grow their customer base.
- 86% of small and medium-sized businesses use YouTube for video marketing.
- 90% of YouTube users have discovered new brands or products on the platform.
- 90% of marketers use YouTube for their video marketing efforts.
- 78% of marketers consider YouTube an effective platform for video marketing.
- Over 500 hours of video content are uploaded to YouTube every minute.
- YouTube generated $31.5 billion in global advertising revenue in 2023.
- 67% of B2C marketers use YouTube for content marketing.
- YouTube is the second most visited website globally, after Google.
- 74% of people use social media when making a purchasing decision, with YouTube being a significant platform.
- 48.7 minutes is the average daily time spent on YouTube by users.
Source:
- 65+ YouTube Marketing Statistics for 2025 That Will Blow Your Mind | WebFX
- 100+ YouTube Statistics in 2025: Users, Revenue & More | Notta
- Latest YouTube Statistics (2025) | Analyzify
- Oxford Economics
- YouTube Revenue and Usage Statistics (2025) | Business of Apps
- 27+ Top YouTube Statistics For 2025: Usage, Demographics, Trends | Startup Bonsai
- 25 YouTube Stats: Users, Marketing, Demographics [2024 Updated] | Sprout Social
- SMB Video Marketing Statistics: Top Platforms for Engagement and Conversion | UpCity
Average Time Spent On Social Media
Let us look at the average time spent on social media and the average time spent on a specific social media platform to get a better idea of where businesses should focus their marketing efforts.
| Platform | Time |
| 35 minutes | |
| 20.45 minutes | |
| Youtube | 29 minutes and 37 seconds |
| TikTok | 95 minutes |
| 17 minutes | |
| 15 minutes | |
| Snapchat | 30.1 minutes |
| 53 minutes | |
| 37.2 minutes |