59+ Powerful Website Statistics For SMB & B2B (2026 updated)
Websites did not always matter this much.
In 1991, the first website went live, and by 2015, Google shifted to mobile first search, changing how businesses compete online. Today, a website is often the first sales meeting. In fact, 75% of people judge a business’s credibility by its website, and 88% will not return after a bad experience.
For comparison, a weak website can lose trust faster than a bad sales call. Now, with AI search, faster pages, and higher buyer expectations, website performance has become a make or break factor for SMB and B2B growth.
With that in mind, we’ll cover some powerful statistics about websites in 2026, which include small business website statistics, load time, hacking, and many more.
01.
General Website Statistics: Key Numbers
- 1.88 billion websites exist today, and 200 million of them are active.
- 175 websites go live every single minute.
- 71% of small businesses have a website.
- 67.56% of all website traffic comes from mobile users.
- 94% of first impressions are based on website design.
- 75% of users judge a company’s credibility by its website design.
- 3.21 seconds is the average load time for websites.
- Around 30,000 websites are hacked daily.
Sources: (Statista, U.S. Chamber of Commerce, similarweb, Forrester Research, Stanford University, Pingdom, Linkedin)

02.
Small Business Website Statistics
Small business websites are more than just digital storefronts. They are powerful tools that can elevate a brand’s online presence and drive business growth.
- 71% of small businesses have their own website.
- First impressions are 94% design related.
- 75% of consumers judge a business’s credibility based on their website
- 81% of shoppers research a business online before making a purchase.
- Small businesses with websites grow 2X as fast as those without.
- 48% of people said that the number one factor they used to determine a business’s credibility was their website design
- Over 1 out of 3 of small business owners feel that their business is too small for a website.
Small Business Website Growth Rate
According to a study, 73% of small businesses had a website in 2022, compared with just 55% in 2017, which increases the average growth rate by 3.6%.
| Year | % of small businesses have websites |
| 2017 | 55% |
| 2018 | 64% |
| 2019 | No data is available. |
| 2020 | No data is available. |
| 2021 | 72% |
| 2022 | 73% |
| 2023* | 73%* |
02.
Benefits of Having a Website Statistics
Having a solid website can seriously boost your business and connect you with more customers. It’s key for influencing buying decisions and building trust. Check out these stats that show just how much a website can help your business grow and stand out:
- 15–50% is the revenue growth small businesses typically see when they use their websites to engage with customers.
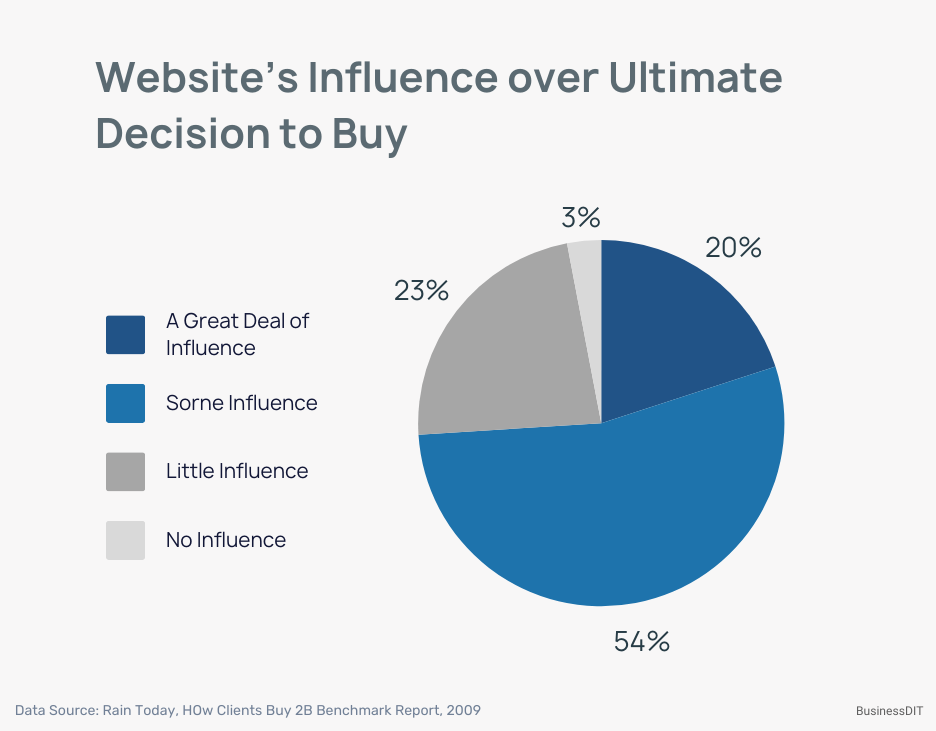
- 97% of customers say websites influence their purchases.
- 91% of customers visited a store after interacting with an online website.
- 84% of consumer a business’s website as more credible than its social media presence.
- 75% of customers judge a business’s credibility through its website design.
- 52.3% of American internet users look up brands online before buying, and 33.5% of them visit the brand’s website.
Sources: (RainPOS, Hubspot, Dicom Interactive, EIN News, 3P Marketing)
03.
Website Traffic Statistics
Website traffic is showing a major shift towards mobile users, making it clear that mobile optimization is a must for any online business. The sheer number of people using the internet worldwide presents huge opportunities for engagement. Check out these key stats:
- 67.56% of website visits are made by mobile users.
- 30.8% of visits to websites are from desktop computers.
- 67.1% of people around the world use the internet.
- 5.44 billion people were using the internet globally as of April 2024.
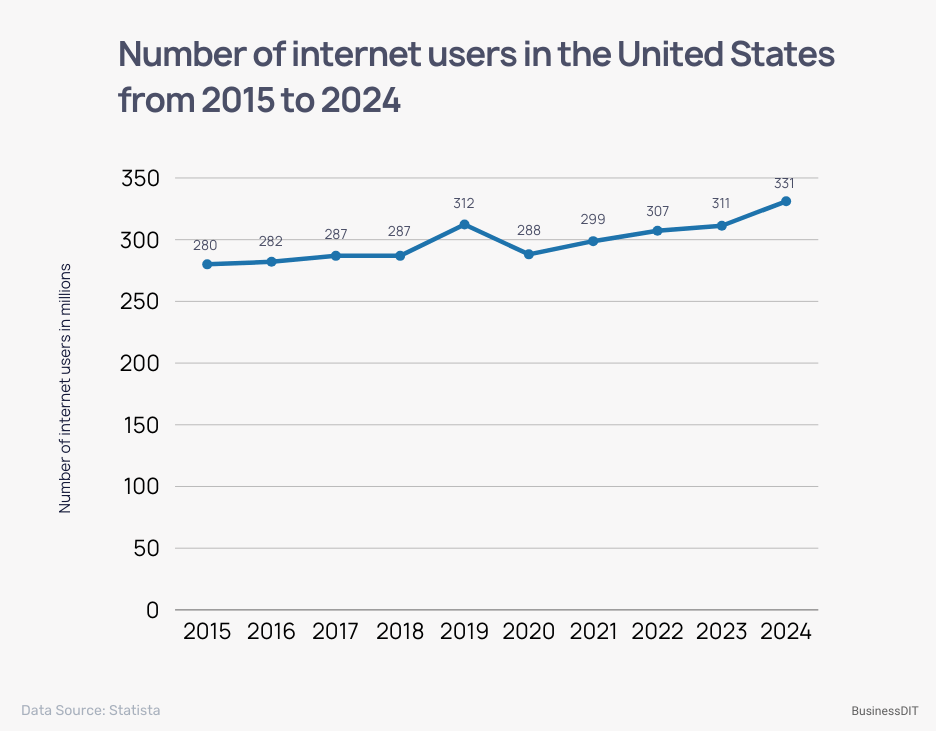
- 343 million people in the U.S. are expected to be internet users by 2029.
Sources: (Similarweb, Statista )
04.
Website first Impression statistics
The visual design of a website plays a pivotal role in forming first impressions. People judge a site almost instantly, so making it visually appealing is a must. Getting important elements noticed quickly can really boost user interaction. Here are some key insights that highlight the critical aspects of web design:
- 94% of first impressions are influenced by how a website looks.
- 50 milliseconds is all people need to make a judgment about a website.
- It takes 2.6 seconds for the eyes to focus on key areas of a web page.

Sources: (CXL, Missouri University of Science and Technology)
05.
Website Load Time Statistics
The visual design of a website plays a pivotal role in forming first impressions. People judge a site almost instantly, so making it visually appealing is a must. Getting important elements noticed quickly can really boost user interaction. Here are some key insights that highlight the critical aspects of web design:
- A website’s average page speed load time is 3.21 seconds.
- As page load time goes from 1 second to 3 seconds, the chance of a bounce goes up by 32%.
- Every 1 second delay reduces user satisfaction by 16%.
- Conversion rates drop by 4.42 percent for every second that it takes to load.
- 40% of website visitors leave a site that takes longer than 3 seconds to load.
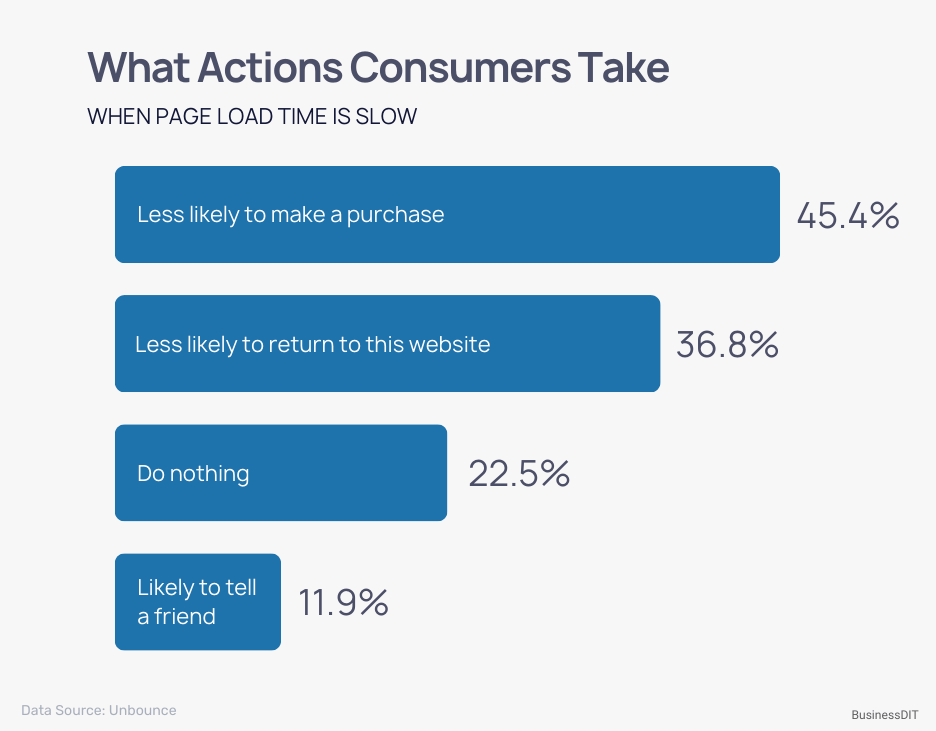
- 70% of consumers have said that the speed of a page affects their willingness to buy from an online retailer.
- 47% of consumers expect a website page to load in two seconds or less.
- 64% of dissatisfied shoppers will not go back to a slow website again.
Sources: (Pingdom, Think with Google, BigCommerce, Duda, BrowserStack, Unbounce, Kiss Metrics.)
06.
Website Hacking Statistics
Website hacking is a huge problem, hitting thousands of sites every day. Small businesses get the worst of it, often because of weak security and old systems. It’s crazy how common this is, especially with popular platforms. Check out these stats that show just how serious it is:
- Around 30,000 websites get hacked worldwide daily.
- Every day, an average of 94 attacks are launched on websites.
- 96.2% of compromised websites are made with WordPress.
- 43% of all cyberattacks are directed at small businesses.
- 1 in 10 small businesses gets hit by a cyberattack each year.
- 81% of data breaches happen due to weak, stolen, or default passwords.

Sources: (Linkedin, Small Business Administration, Terranova Security, Verizon’s 2020 Data Breach Investigations Report, SiteLock)
07.
About Us Page Statistics
The ‘About Us’ page plays a big role in connecting with our visitors, affecting how much they engage and spend. This section shows important stats about why this page matters. Knowing these can help us improve our website to meet what people want and build stronger loyalty:
- Customers who visit your About Us page spend 22.5% more than those who do not.
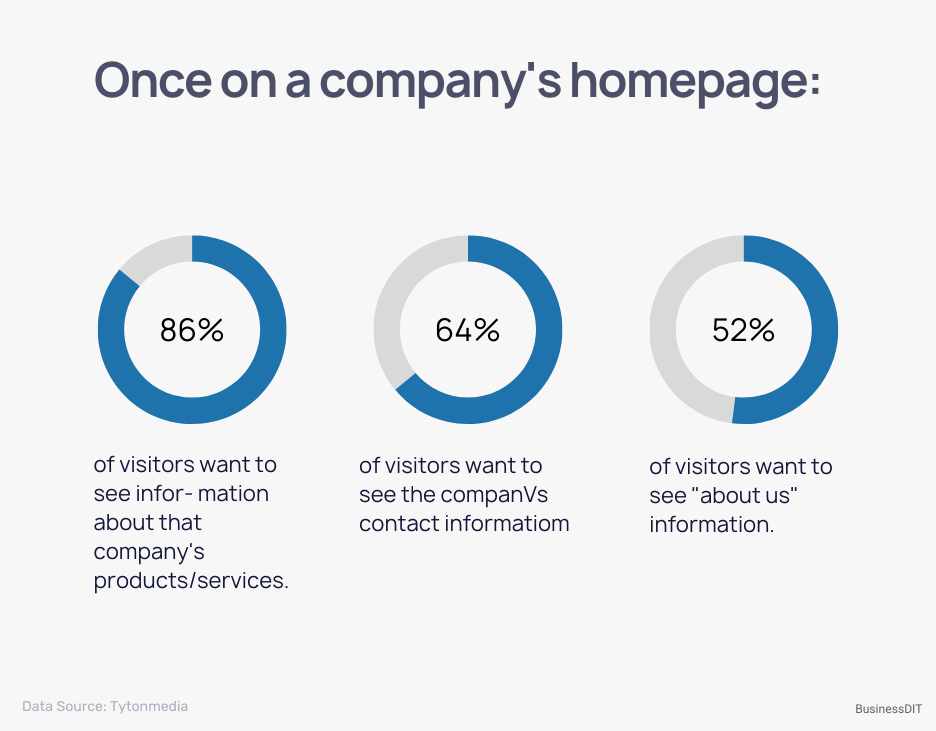
- 52% of people say that when they land on a website, they want to see the “About Us” page first.
- 31% of people say that a website’s “About Us” page is the most important part.
- 44% of website visitors will leave if there is no contact information.
- 63% of consumers prefer to buy from brands that have a purpose.
Sources: (Siege Media, KoMarketing, HubSpot, Accenture, PwC, DemandBase, Expert Market, Oracle.)
08.
Website Accessibility Statistics
Website accessibility is super important but still gets overlooked a lot. Most websites, even the big ones, aren’t doing enough to be user-friendly for people with disabilities. Here’s a look at the major issues and why we need to step up our game in making the web accessible for everyone:
- 98% of American web pages fail to meet legal accessibility standards for the disabled.
- 96% of the world’s top one million web pages fail accessibility standards.
- 86.4% of websites have home pages with low contrast in their text.
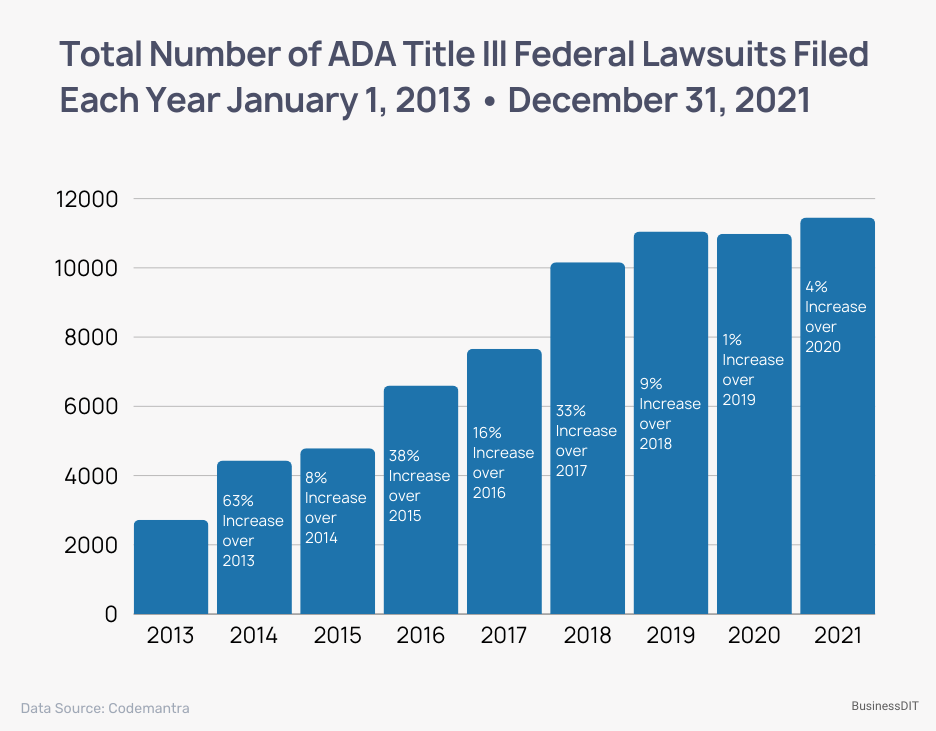
- 2,281 web accessibility lawsuits hit the courts in 2023.
- On average, 51.4 accessibility errors are present on the home pages of the top million websites.
- 42% of disabled individuals feel web accessibility hasn’t improved over the past year.
Sources: (Web Accessibility Annual Report, Accessibility App, HubSpot, Accessibility)
Average Bounce Rate Benchmark, According to 15 Studies & Reports
Based on the data we collected, we calculated that the average bounce rate benchmark is approximately 55.43% across the industry.
Findings: The average bounce rate across these 15 studies and reports from 2018 to 2023 is approximately 55.43%.

This value is an average calculated from 15 different studies and reports containing average website bounce rate benchmarks. As with any average, individual results can vary widely based on specific conditions and contexts, and this should be taken into account when using this figure to inform decision-making.
Average Bounce Rate Benchmark Studies And Published Reports:
- 53.7% CXL 2023 (Study)
- 50% Siege Media 2023 (Study)
- 60.78% DataBox 2023 (Reported)
- 38% Monetate 2022 (Study)
- 56.2% NCBI 2022 (Reported)
- 55.8 SimilarWeb 2022 (Reported)
- 30.5% SimilarWeb 2021 (Study)
- 47% Contentsquare 2021 (Study)
- 62.6% Linkedin 2021 (Reported)
- 55.69% OHO 2021 (Reported)
- 60% Spinutech, Hinge Marketing, and Brafton 2021 (Reported)
- 40% UEA eprints 2020 (Reported)
- 54% Wave 2019 (Study)
- 57.19% Digi Shuffle 2018 (Study)
- 60% Casey Ordona 2021 (Study)
Why is this list being compiled?
Grasping what the average website bounce rate means is crucial for a few key reasons connected to how users interact with your site, how well your site performs, and your business’s overall success.
It offers a critical lens through which businesses and marketers can evaluate the effectiveness of their online presence and identify areas for potential improvement.
So, we put together this average website bounce rate to find out how engaged websites really are. So you can figure out if the rate of people leaving your website is normal or not.
Keeping an eye on this metric is key for making smart choices about what to create, how your website looks, marketing plans, and knowing who you want to reach. By checking it often, you can stay flexible and effective in your digital approach, making things more interesting for visitors and possible customers.